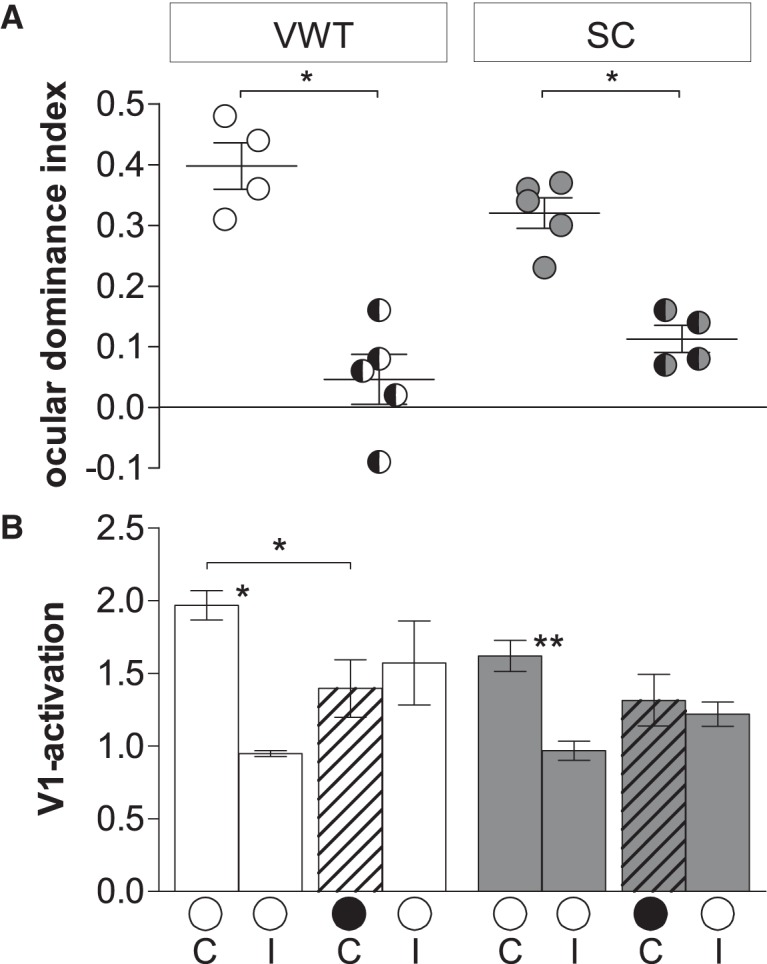
Figure 9.

Quantification of visual cortical activation before and after MD. ODI (A) and V1 activation (B) in V1 of VWT-trained and SC mice. A, Optically imaged ODIs without (no-MD) and with MD in VWT (white) and SC (gray) mice. Symbols represent ODI values of individuals; means are marked by horizontal lines. MD is indicated by half-black circles. B, V1 activation elicited by stimulation of the contralateral (C) or ipsilateral (I) eye in VWT and SC mice with MD. Black filled circles indicate MD eye. A, B, Data represented as mean ± SEM. Statistical significance was tested by Mann–Whitney tests: *p < 0.05; **p < 0.01.
