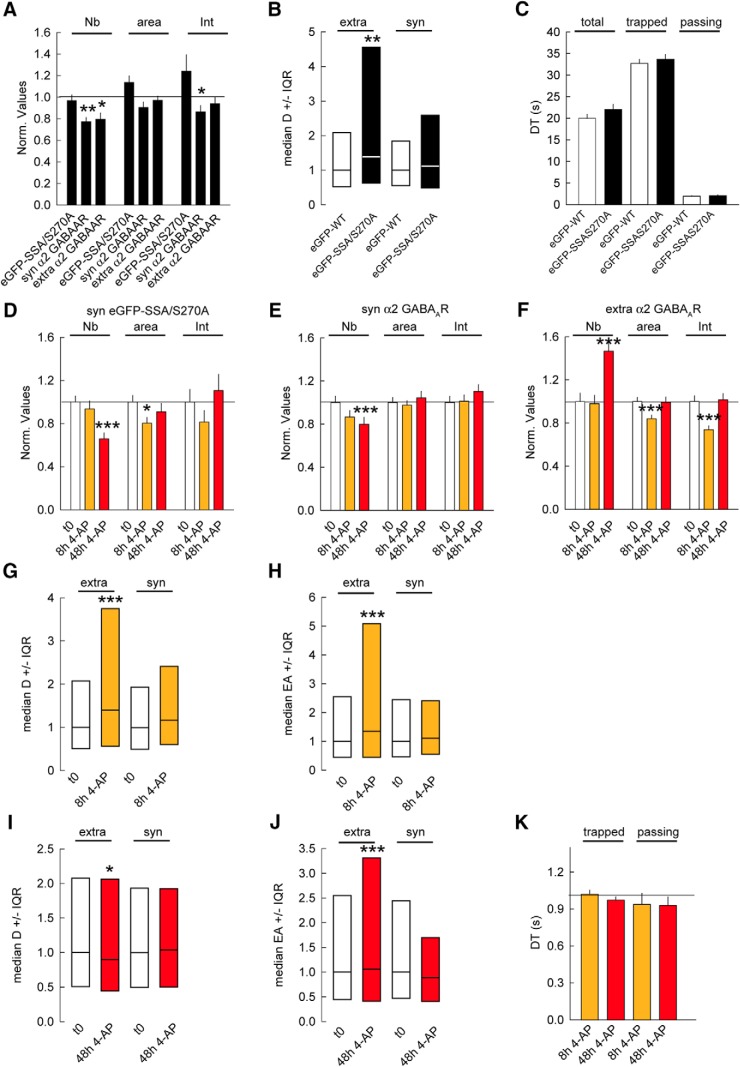
Figure 8.
PKA, CAMKIIα, and GSK3β pathways are required to tune the inhibitory synapse. A, Quantifications of synaptic eGFP-SSA/S270 clusters and synaptic (α2 syn) and extrasynaptic (α2 extra) α2 GABAAR clusters in relation to eGFP-WT show minor impact of the mutant under control condition. eGFP-WT n = 58 cells, eGFP-SSA/S270A n = 62 cells, 3 cultures. eGFP-SSA: Cluster Nb: p = 0.6; Area: p = 0.1; Intensity: p = 0.7. α2 syn: Cluster Nb: p = 0.001; Area: p = 0.1; Intensity: p = 0.02. α2 extra: Cluster Nb: p = 0.03; Area: p = 0.5; Intensity: p = 0.2. B, Quantification of median diffusion coefficient D of α2 GABAAR in neurons expressing eGFP-WT or eGFP-SSA/S270A under control condition. Extra: WT n = 823 QDs, SSA/S270A n = 786 QDs, p = 0.004; Syn: WT n = 261 QDs, SSA/S270A n = 211 QDs, p = 0.3, 2 cultures. C, Quantification of α2 GABAAR dwell time DT at synaptic sites in neurons expressing either eGFP-WT or eGFP-SSA/S270A. Calculations were done for all QDs (total), (trapped), or (passing) QDs at inhibitory synapses. No significant differences were found between eGFP-WT and eGFP-SSA/S270A. Total: WT n = 165 QDs, SSA/S270A n = 183 QDs, p = 0.1; Trapped: WT n = 95 QDs, SSA/S270A n = 116 QDs, p = 0.5; Passing: WT n = 70 QDs, SSA/S270A n = 67 QDs, p = 0.2. D, Quantification of eGFP-SSA/S270A clusters after 8 or 48 h of 4-AP application. t0 n = 53 cells, 8 h n = 45 cells, 48 h n = 51 cells, 3 cultures. Cluster Nb: 0–8 h: p = 0.3, 0–48 h: p < 0.001; Area: 0–8 h: p = 0.03, 0–48 h: p = 0.2; Intensity: 0–8 h: p = 0.3, 0–48 h: p = 0.9. E, Quantification of synaptic α2 GABAAR clusters after 8 and 48 h of 4-AP compared with mock treated control. t0 n = 49 cells, 8 h n = 49 cells, 48 h n = 39 cells, 3 cultures. Cluster Nb: 0–8 h: p = 0.2, 0–48 h: p < 0.001; Area: 0–8 h: p = 0.8, 0–48 h: p = 0.6; Intensity: 0–8 h: p = 0.2, 0–48 h: p = 0.9. F, Quantification of extrasynaptic α2 GABAAR clusters after 8 and 48 h of 4-AP compared with mock treated control. Cluster Nb: 0–8 h: p = 0.8, 0–48 h: p = 0.001; Area: 0–8 h: p < 0.001, 0–48 h: p = 0.7; Intensity: 0–8 h: p = 0.8, 0–48 h: p = 0.8. G, Quantification of α2 GABAAR diffusion coefficients after 8 h of 4-AP exposure. Extra: t0 n = 624 QDs, 4AP 8 h n = 421 QDs, p = 5.4 × 10⁻⁷. Syn: t0 n = 252 QDs, 8 h n = 173 QDs, p = 0.2, 2 cultures. H, Quantification of explored area EA of α2 GABAAR after 8 h of 4-AP application. Extra: t0 n = 1869 QDs, 8 h n = 1092 QDs, p = 7.8 × 10⁻¹⁴. Syn: t0 n = 753 QDs, 8 h n = 516 QDs, p = 0.07. I, Quantification of α2 GABAAR diffusion coefficients after 48 h of 4-AP exposure. Extra: t0 n = 624 QDs, 4AP 48 h n = 631 QDs, p = 0.04. Syn: t0 n = 252 QDs, 48 h n = 251 QDs, p = 0.8. 2 cultures. J, Quantification of explored area EA of α2 GABAAR after 48 h of 4-AP application. Extra: t0 n = 1092 QDs, 48 h n = 1890 QDs, p = 1.5 × 10⁻⁶. Syn; t0 n = 558 QDs, 48 h n = 750 QDs, p = 0.3. K, Quantification of α2 GABAAR dwell time DT after 8 or 48 h of 4-AP application. Calculations were done for trapped or passing QDs at inhibitory synapses. Trapped: t0: n = 116 QDs, 8 h: n = 84 QDs, 48 h: n = 43 QDs, 0–8 h: p = 0.2; 0–48 h: p = 0.02; Passing: t0: n = 67 QDs, 8 h: n = 46 QDs, 48 h: n = 43 QDs, 0–8 h: p = 0.2; 0–48 h: p = 0.1. In A, C–F, and K, data are presented as mean ± SEM. *, p ≤ 0.05; ***, p ≤ 0.001 (Mann–Whitney rank sum test). In G–J, data are presented as median values ± 25%–75% IQR. *, p ≤ 0.05; ***, p ≤ 0.001 (Kolmogorov–Smirnov test). In all graphs except C, values were normalized to the corresponding control values.

