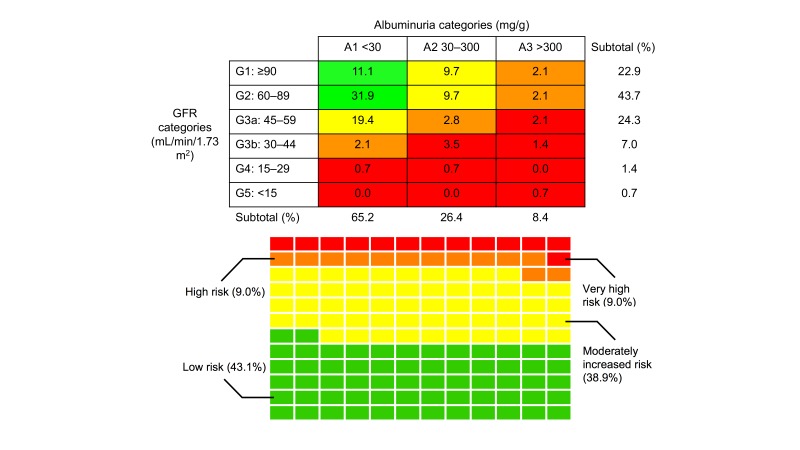
Figure 1.
Risk of chronic kidney disease (CKD) progression. (Top panel) Risk map for CKD progression. Cells coded by Kidney Disease: Improving Global Outcomes (KDIGO) risk level as follows: green, low risk; yellow, moderately increased risk; orange, high risk; red, very high risk. Glomerular filtration rate (GFR) was calculated using CKD-Epidemiology Collaboration equation. KDIGO designations are as follows: A1, normal to mildly increased albuminuria; A2, moderately increased albuminuria; A3, severely increased albuminuria; G1, normal or high GFR; G2, mildly decreased GFR; G3a, mildly to moderately decreased; G3b, moderately to severely decreased GFR; G4, severely decreased GFR; G5, kidney failure. (Bottom panel) Waffle chart of KDIGO CKD risk progression categories. Each rectangle denotes a single patient in the sample (n=144). Cells are coded by KDIGO risk as in the top panel.

