
Figure 1.
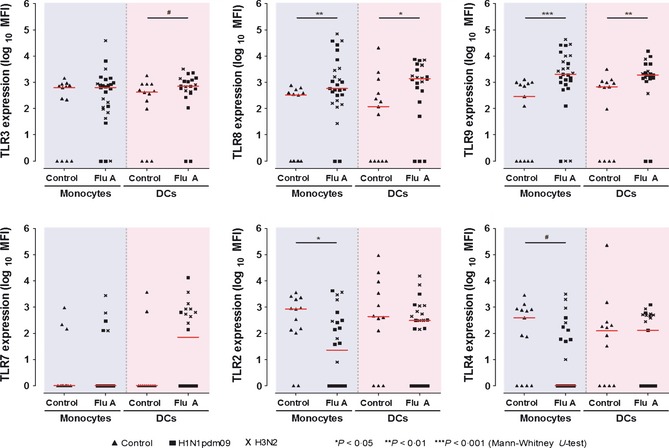
Expressions of Toll‐like receptors (TLRs 2, 3, 4, 7, 8, 9) in monocytes and dendritic cells (DCs) in influenza A patients and age‐gender matched controls, measured by quantitative flow cytometry. The mean fluorescence intensity (MFI) values are represented in logarithmic scale (median values indicated by horizontal bars in red). Each point represents the MFI in an individual study subject. ‘Monocytes’ [patients versus controls, MFI median (IQR)]: TLR8, 587·0 (202·0, 3374·0) versus 328·0 (1·0, 469·5), P = 0·006; TLR9, 2056·0 (819·0, 9996·0) versus 293·0 (1·0, 954·0), P < 0·001; TLR2, 23·0 (1·0, 296·5) versus 840·0 (119·0, 2159·5), P = 0·031; TLR4, 1·0 (1·0, 155·0) versus 388·0 (1·0, 842·5), P = 0·061. ‘Total Dendritic Cells, DCs’: TLR3, 711·0 (415·5, 1304·5) versus 420·0 (48·5, 859·0), P = 0·079; TLR8, 1389·0 (401·8, 4412·3) versus 118·0 (1·0, 852·0), P = 0·024; TLR9, 1906·0 (1411·5, 3817·0) versus 676·0 (1·0, 1046·0), P = 0·001; TLR7, 70·0 (1·0, 694·8) versus 1·0 (1·0, 1·0), P = 0·147. Detection of TLR7 (positive), 50·0% versus 18·2%, P = 0·078. Representative flow‐cytometry histograms (including isotypic control) and subgroup analyses on mDC and pDC are provided in Data S2. Available convalescentphase samples from 6 influenza patients showed normalizing TLR8, 9 and TLR2, 4 levels (also see Table 3).