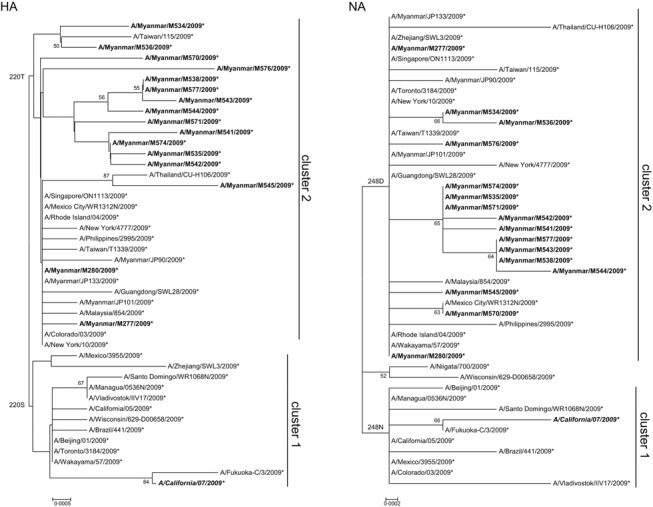
Figure 3.

Phylogenetic analysis of HA and NA genes of 2009 pandemic influenza A (H1N1) isolates in Myanmar in 2008 and 2009. Trees were inferred using the neighbor‐joining method. Figures on the left side of the branches indicate the percentages of replicated trees using bootstrap analysis (1000 replicates). Amino acid changes that characterized a particular branch are indicated on the left side of the node. Myanmar isolates are boldfaced. Vaccine strains are boldfaced and italicized.
