
Figure 3.
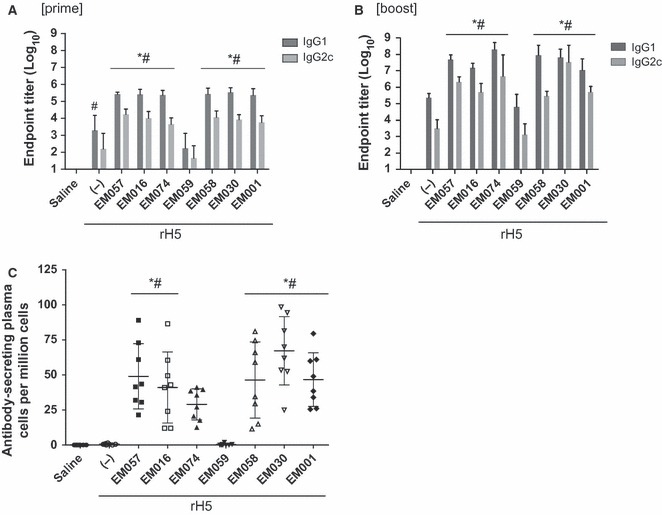
Antibody responses to rH5 vaccines containing various emulsions as measured after prime and boost immunizations. For simplicity, not all significant differences between groups are displayed on the graphs; those not indicated on the graphs are described below. (A) Post‐prime IgG1 and IgG2c antibody endpoint titers. (B) Post‐boost IgG1 and IgG2c antibody endpoint titers. Statistical differences between groups not indicated on the graph are as follows (P < 0·05): (IgG1) EM001 versus EM030, EM058, and EM074; EM016 versus EM058 and EM074; (IgG2) EM030 versus EM001, EM057, EM016, and EM058; EM074 versus EM058. (C) Long‐lived antibody‐secreting cells in the bone marrow detected post‐boost. Statistical differences between groups not indicated on the graph are as follows (P < 0·05): EM030 versus EM074. Error bars represent standard deviation of the mean.