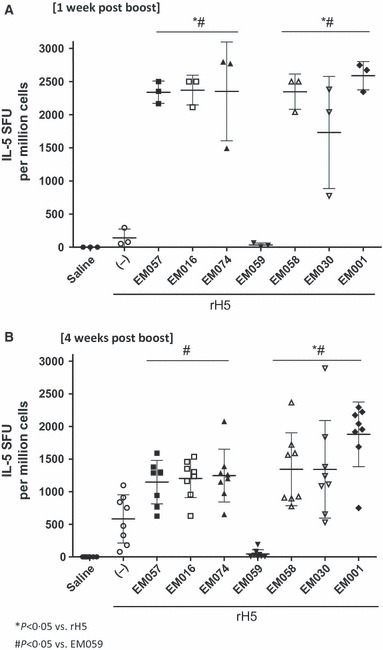
Figure 5.

Antigen‐specific IL‐5 producing cells detected (A) 1 or (B) 4 weeks after boost immunization. Statistical differences between groups not indicated on the graph are as follows (P < 0·05): (4 weeks post‐boost) EM001 versus EM057. Error bars represent standard deviation of the mean.
