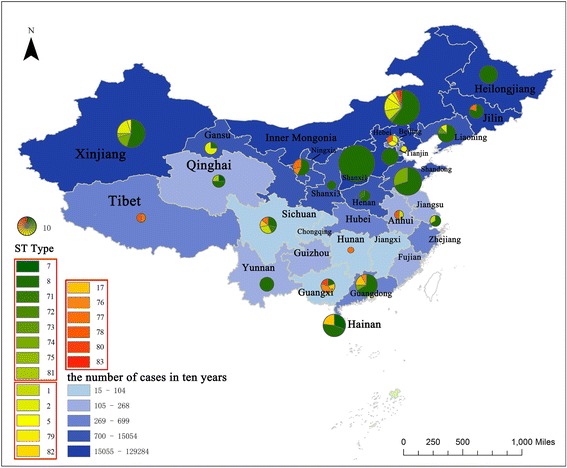
Fig. 1.

Distribution of MLST in China. Size of circles reflects the number of isolates in a particular province. Color of sectors reflects the genotypes of isolates as the legend displays. The genotypes belong to one identical cluster were framed with red line in the legend. Shade of blocks reflects the number of cases in recent ten years in a particular province
