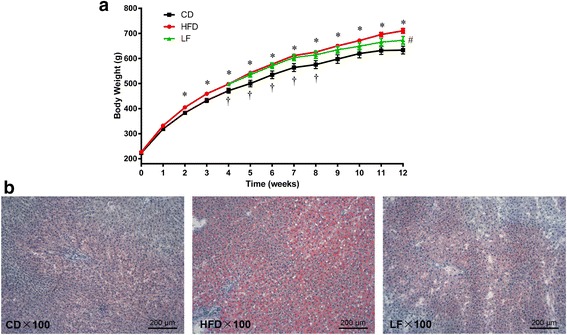
Fig. 1.

Effects of LF on body weight gain and the morphology of the liver in HFD-fed rats. a Body weight gain; b Micrographs of rat liver specimens from CD, HFD, and LF treatment groups. Values are expressed as means ± standard error. Differences were assessed by ANOVA and denoted as follow: values are statistically significant at p < 0.05; *, significantly different from the CD group; #, significantly different from the HFD group; †, significantly different from the LF group (n = 10)
