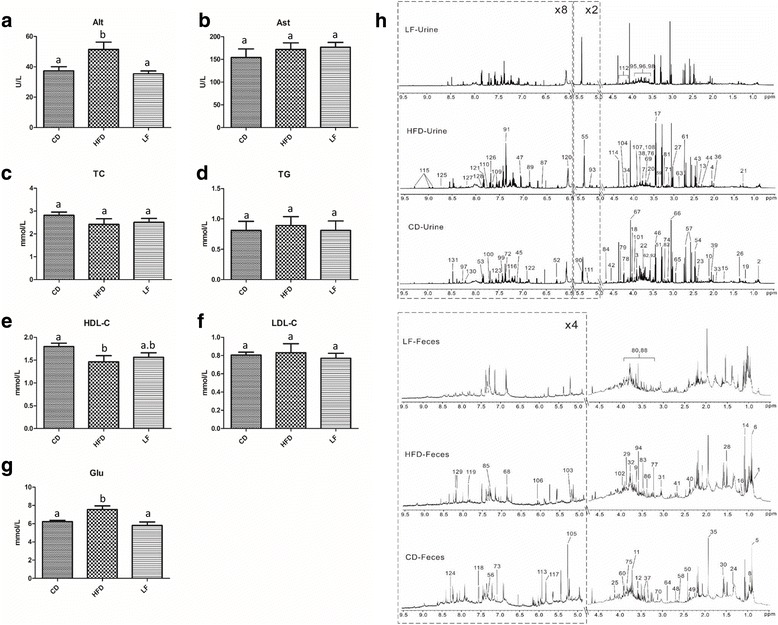
Fig. 2.

Influences of LF on the liver, blood lipids and serum glucose in HFD-fed rats, and typical 600 MHz 1H NMR spectra of urine and feces. a Serum Alt; b serum Ast; c serum TC; d serum TG; e serum HDL-C; f serum LDL-C; g serum Glu; h typical 600 MHz 1H NMR spectra of urine and feces from CD, HFD and LF treated rats at 12 week. Abbreviations: Alt, alanine aminotransferase; Ast, aspartate aminotransferase; TC, total cholesterol; TG, total triglycerides; HDL-C, high-density lipoprotein cholesterol; LDL-C, low-density lipoprotein cholesterol; Glu, glucose. Values are expressed as means ± standard error. Graph bars with different letters on top represent statistically significant results (p < 0.05) based on one-way ANOVA analysis, whereas bars with the same letter correspond to results that show no statistically significant differences. In the case where two letters are present on top of the bars in (e), each letter should be compared separately with the letters of other bars to determine whether the results show statistically significant differences
