
Fig. 4.
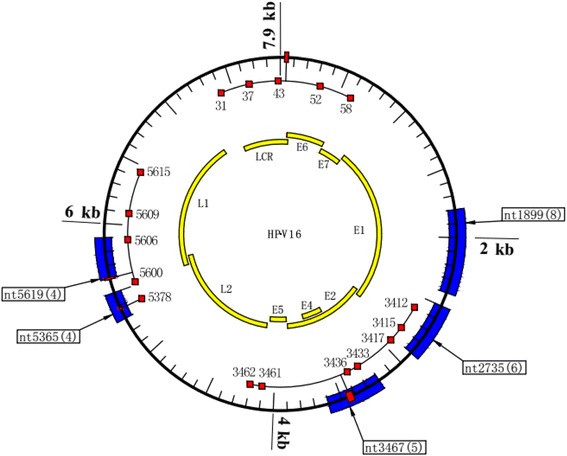
Recurrent breakpoints and methylated CpG islands near interruption sites are shown in the above map of the HPV 16 genome. The arrows indicate the location and the attached boxes state the number of integrations identified in this study. The red boxes represent the nearby methylated CpG sites. The frequently interrupted regions of E1, E2/E4, L1, and L2 are represented by the blue boxes