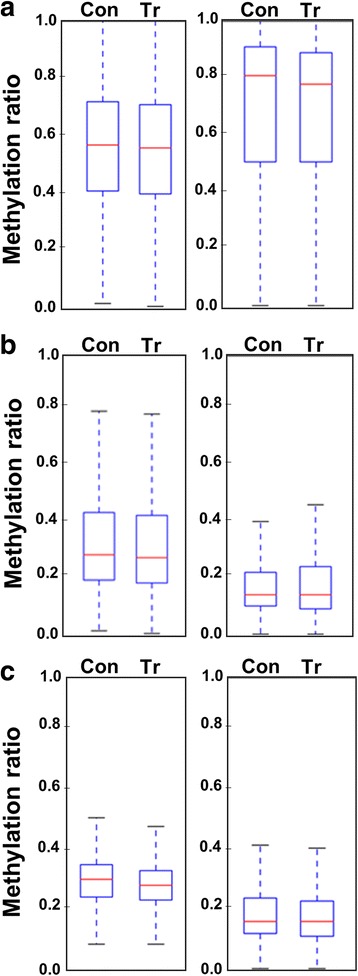
Fig. 2.

Box plots display the overall methylation level of significantly (p < 0.05, FDR ≤ 0.05) methylated sites measured as methylation ratios among promoter (left panel) and coding regions (right panel), under control (Con) and salinity stress conditions (Tr). mCGs are shown in a, mCHGs in b, and mCHHs in c. A line within the bars represents the median
