Fig. 3.

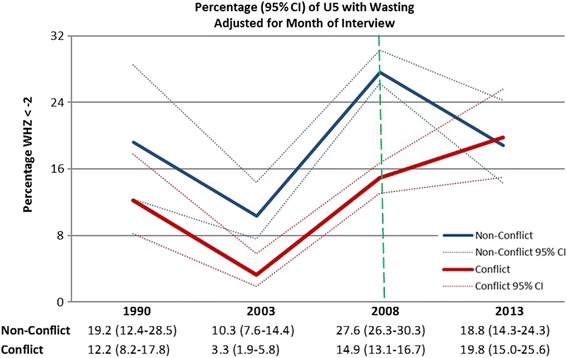
Trends in wasting in Northeast Nigeria’s conflict and non-conflict states. Percentages are adjusted for month of household interview. Dashed green line is the time point between the 2008 and 2013 surveys where the trends diverge

Trends in wasting in Northeast Nigeria’s conflict and non-conflict states. Percentages are adjusted for month of household interview. Dashed green line is the time point between the 2008 and 2013 surveys where the trends diverge