
Fig. 4.
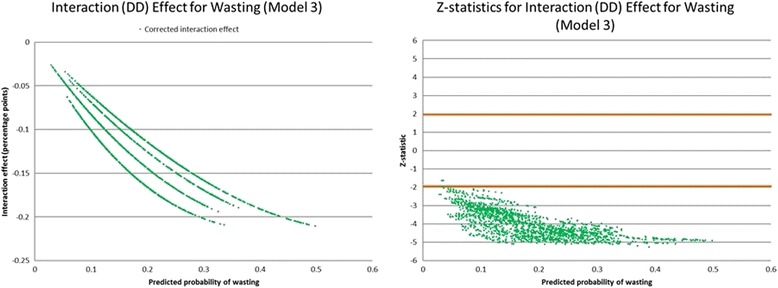
Graphic representation of the marginal effects for the interaction term (double-difference) for wasting, Model 3 with select covariates. Left panel is the interaction effect and right panel is z-statistics for individual children
Official websites use .gov
A
.gov website belongs to an official
government organization in the United States.
Secure .gov websites use HTTPS
A lock (
) or https:// means you've safely
connected to the .gov website. Share sensitive
information only on official, secure websites.
Graphic representation of the marginal effects for the interaction term (double-difference) for wasting, Model 3 with select covariates. Left panel is the interaction effect and right panel is z-statistics for individual children