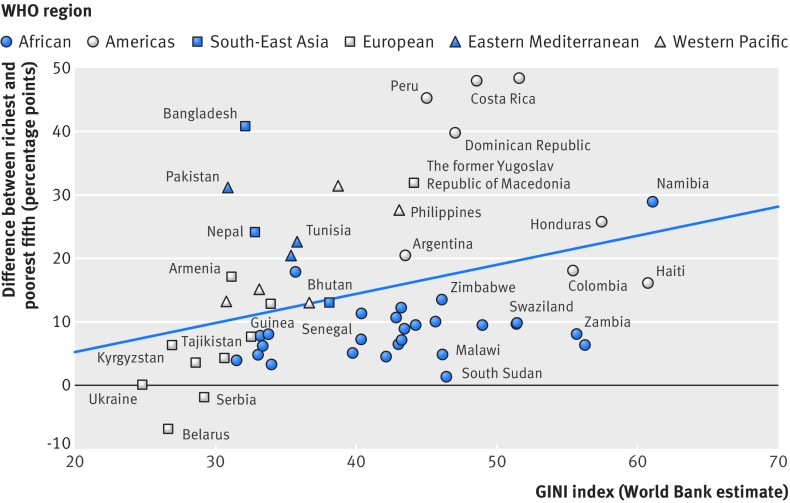
Fig 4.
Income inequality (GINI index) compared with wealth related inequality in caesarean section rates (difference between richest and poorest fifths) in 57 low and middle income countries, by World Health Organization region. Shapes indicate countries, with each country represented by one shape. The blue line (regression line) indicates the association between income inequality and wealth related inequality in caesarean section rates

