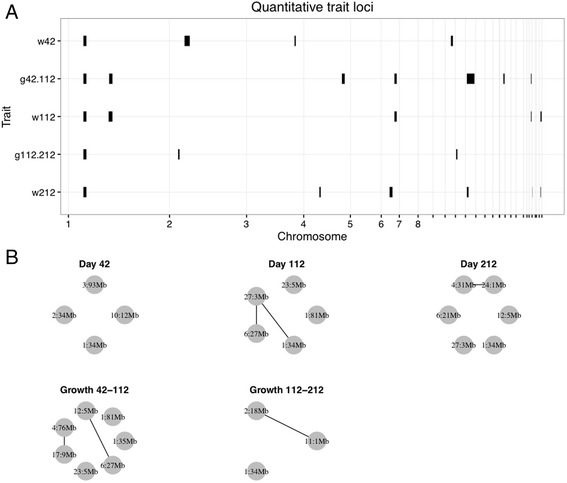
Fig. 1.

a Genomic confidence intervals of the QTL. The horizontal axis shows physical locations along the chicken genome (chromosomes 1 to 28). The red lines indicate QTL overlap between at least two traits. b Epistatic networks for body mass and growth loci. Nodes represent loci, labelled by their chromosome and physical location, and edges pairwise epistatic interactions between them
