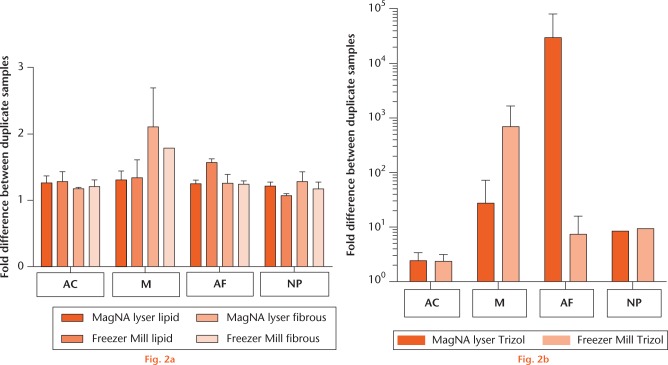
Graph showing the comparison of tissue homogenisation methods. The variances in aggrecan gene expression between two duplicate samples for the four cartilaginous tissues isolated with the same kit homogenised by either the MagNA Lyser (dark orange) or Freezer Mill (second bar from left): a) for the RNeasy Lipid (left hand bars × 2) and Fibrous (right hand bars × 2) kits; and b) for TRIzol. Data are presented as mean and standard error. Note the linear scale for graph (a) and the logarithmic scale for graph (b). As the aggrecan gene expression of NP tissue after RNA isolation with TRIzol could only be determined for the duplicates of the samples of one goat for both homogenisation methods, no error bars are shown. (AC, articular cartilage; M, meniscus; AF, annulus fibrosus; NP, nucleus pulposus.)

An official website of the United States government
Here's how you know
Official websites use .gov
A
.gov website belongs to an official
government organization in the United States.
Secure .gov websites use HTTPS
A lock (
) or https:// means you've safely
connected to the .gov website. Share sensitive
information only on official, secure websites.
