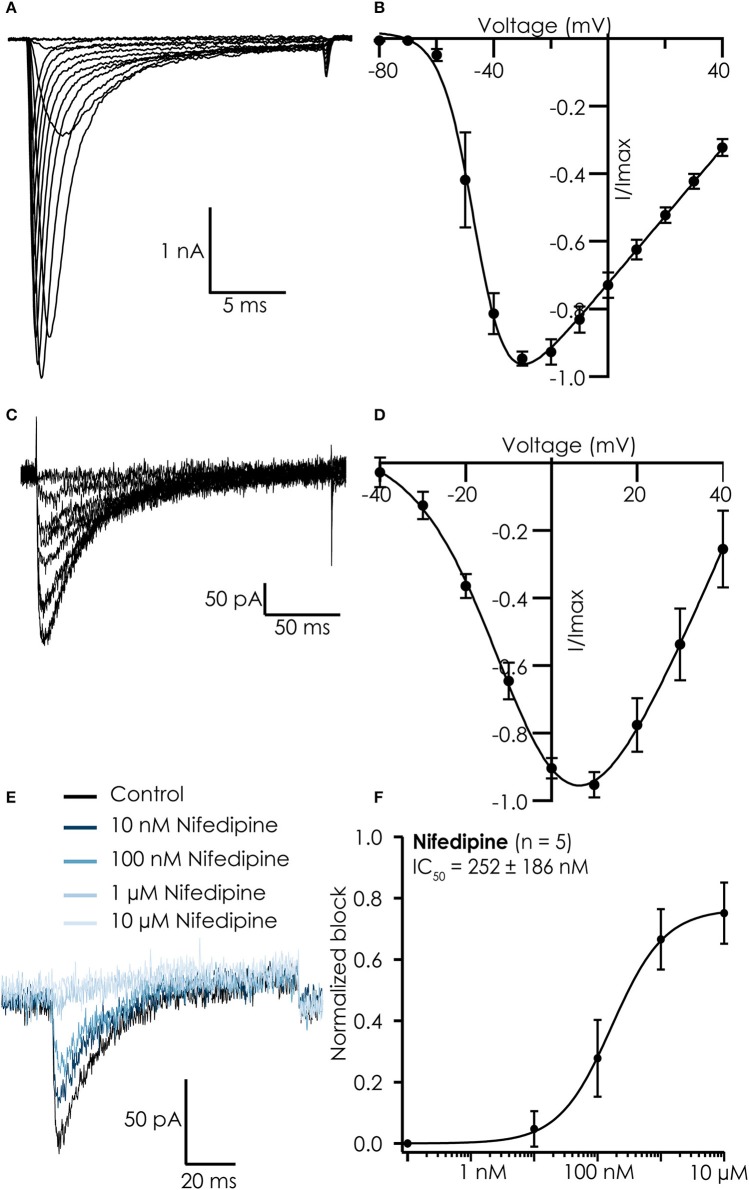
Figure 2.
Typical recordings from hiPSC Cellartis Cardiomyocytes recorded on the Patchliner. (A) Na+ currents in response to increasing voltage steps. (B) Corresponding current-voltage plot for an average of 7 cells. A Boltzmann fit revealed a Vhalf of activation of −46 mV. (C) Ca2+ currents in response to increasing voltage steps. (D) Corresponding current-voltage plot for an average of 18 cells. A Boltzmann fit revealed a Vhalf of activation of −5.8 mV. (E) Raw traces of Ca2+ current in control conditions (black) and after inhibition by increasing concentrations of nifedipine (blue). (F) The concentration response curve (normalized to maximum block) for nifedipine for an average of 5 cells. The average concentration response curve was fitted with a standard Hill-equation which revealed an IC50 = 252 ± 186 nM (n = 5).

