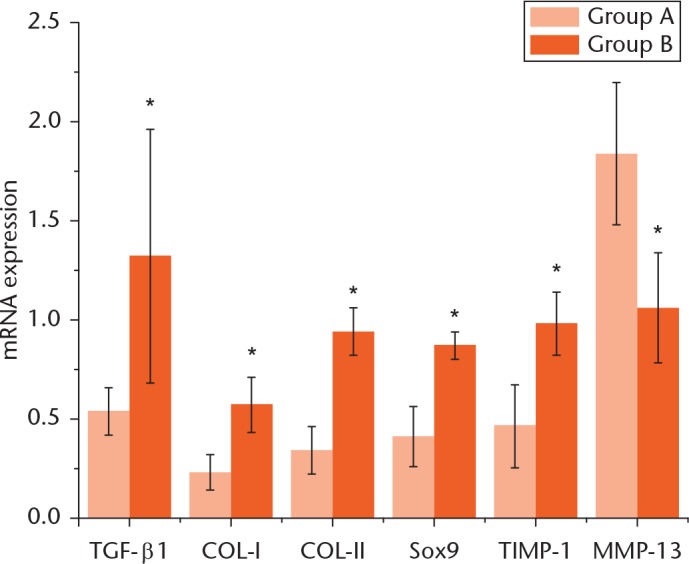
Fig. 1.

mRNA expression of TGF-β1, COL1, COL2, SOX9, TIMP-1 and MMP-13 in the ligament tissue of rabbits in both control (A) and treatment (B) groups. The line segments on each bar chart indicate a 95% confidence interval (CI) for that value. *Indicates a significant difference compared with the value in group A (p < 0.05).
