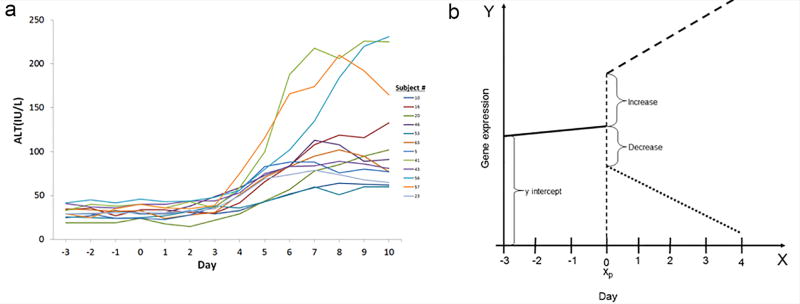
Figure 2.
Response to acetaminophen dosing. (a) Plot of alanine aminotransferase (ALT) in IU/L for each of the responder subjects at a given day. (b) Discontinuous piecewise regression. Representation of the response function for a discontinuous piecewise regression on genes expression (y-axis) dependent on the day of blood draw (x-axis). Xp is the jump point between the two regression lines and denotes the point at which acetaminophen is given. The solid line represents a gene expression response during the acclimation period. The dashed line represents an increase in gene expression following dosing of acetaminophen. The slanted dotted line represents a decrease in gene expression following dosing of acetaminophen.

