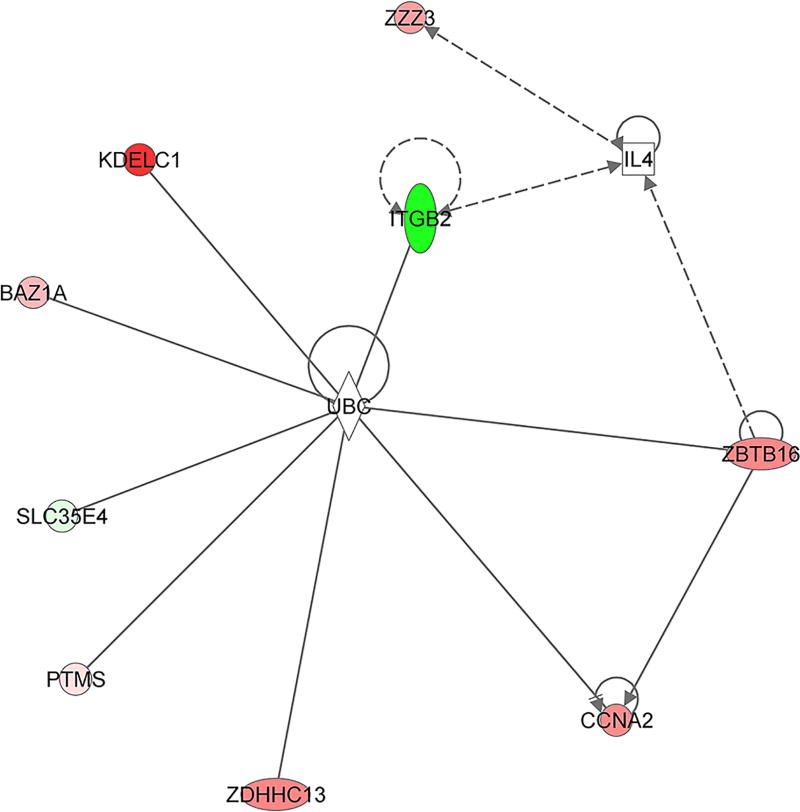
Figure 5.
Gene interaction network. Using 9 of the 12 early response genes detected in the responders that were mapped to pathways in the Ingenuity Pathway Analysis canonical database, molecular networks were generated. Colored nodes represent genes that are part of the 12 early response genes. Red represents increased expression, green, decreased expression. Shapes representations: Circles, protein-coding genes; diamond, enzyme; square, cytokine; horizontal ovals, transcription regulators; vertical oval, transmembrane receptor. A solid line represents a direct interaction whereas a dashed line represents an indirect interaction. A line with an arrow denotes activation whereas a line with an arrow and a pipe (|) denotes acts on and inhibits respectively. A line without an arrow or pipe (|) denotes a protein-protein interaction.

