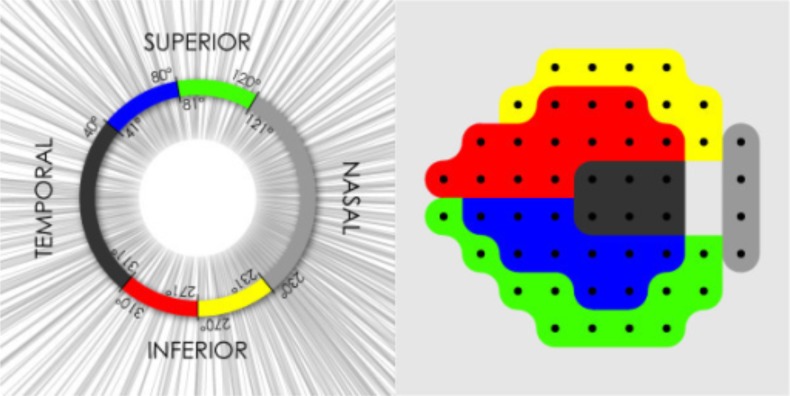
Figure 1.
Map representing the relationship between standard automated perimetry visual field sectors and sections of the peripapillary OCT scan circle. Right panel: yellow corresponds to Superior/Nasal; red corresponds to Superior/Temporal; blue corresponds to Inferior/Temporal; and green corresponds to Inferior/Nasal. Bizios D et al. Integration and fusion of standard automated perimetry and optical coherence tomography data for improved automated glaucoma diagnostics. Bizios D, Heijl A, & Bengtsson B. Integration and fusion of standard automated perimetry and optical coherence tomography data for improved automated glaucoma diagnostics. BMC Ophthalmol. 2011;11:20. ©2011 Bizios et al.; licensee Bio Med Central Ltd. Creative Commons Attribution License (http://creativecommons.org/licenses/by/2.0)

