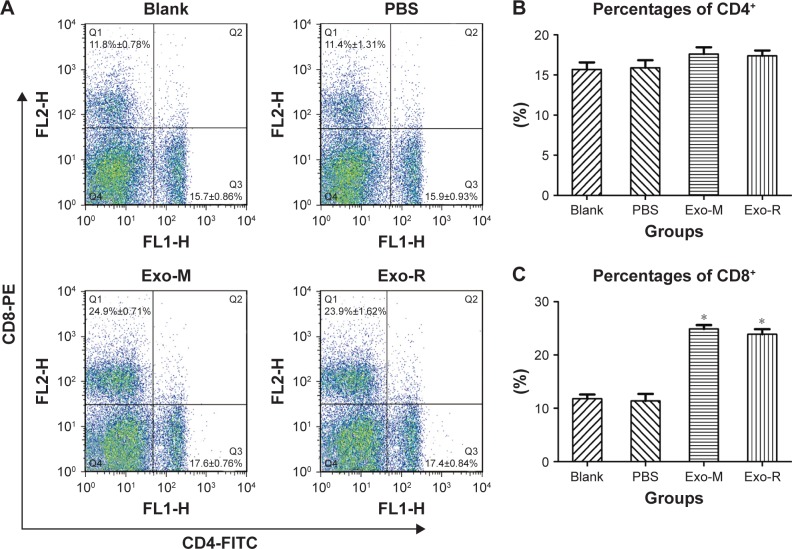
Figure 6.
Flow cytometry analysis of T cell subsets.
Notes: The total mouse spleen cells were analyzed by using anti-mouse-CD3e-PE-cy5.5, anti-mouse-CD4-FITC and anti-mouse-CD8-PE for quality control. (A) The percentages of CD4+ (region Q3) and CD8+ (region Q1) T cells in the spleen of immunized mice are shown and the results are representative of three independent experiments. (B) The percentages of CD4+ and (C) the percentages of CD8+. One of three individual experiments is shown. n=4 animals per group, *p<0.05 compared with PBS or Blank control.
Abbreviations: Exo-R, exosomes from RH strain; Exo-M, exosomes from ME 49 strain; FITC, fluorescein isothiocyanate; PE, phycoerythrin.

