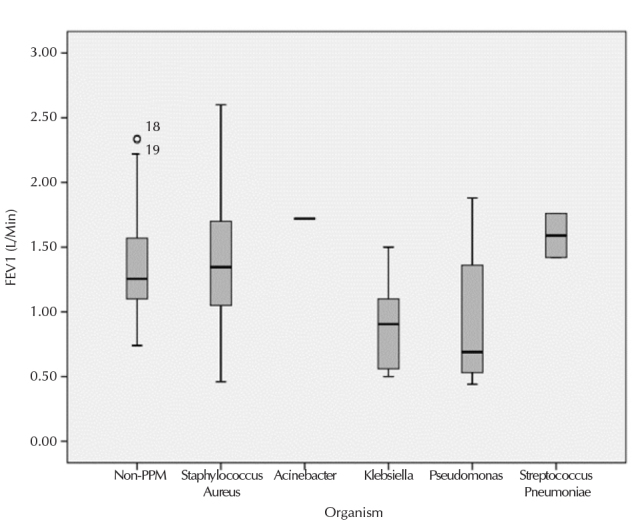
Figure 2.

FEV1 represented as mean value, SD and range for PPMs separately and non-PPMs as whole group. Horizontal bars represent mean values, boxes represent mean±SD, and vertical bars represent 95% CI
PPMs: potentially pathogenic microorganisms; FEV1: forced expiratory volume in 1 second; SD: standard deviation; CI: confidence interval
*Acinetobacter was recovered in one sputum sample, so represent as single bar
