
Fig. 3. Adrb2 depletion increases endothelial oxidative metabolism.
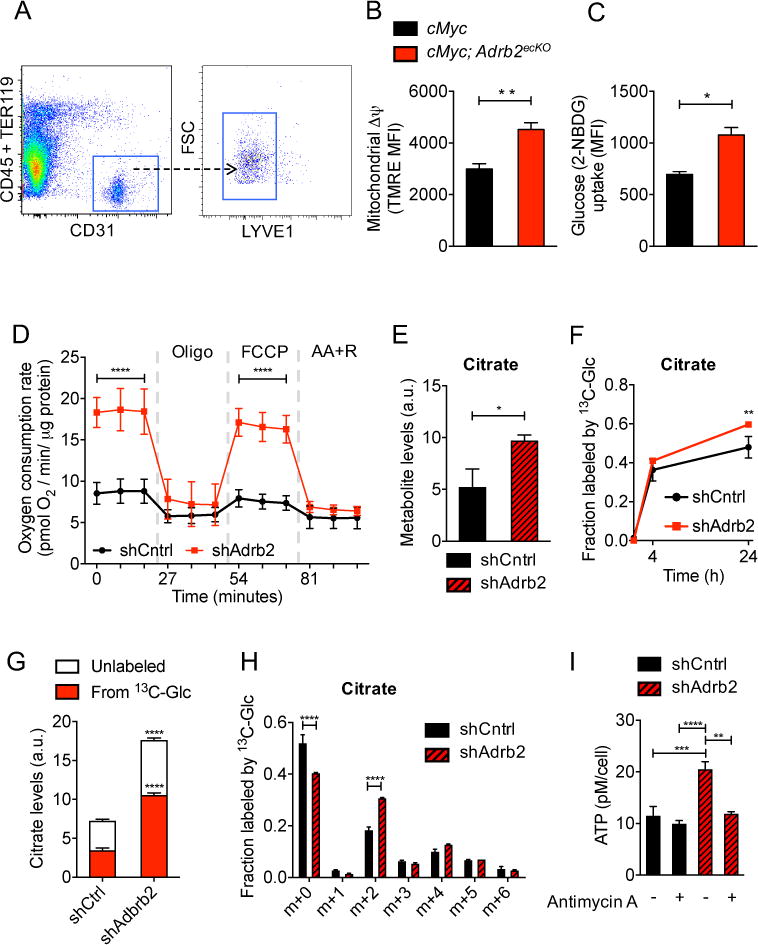
(A to C) FACS analysis of HPIN-stage endothelial cells. (A) Representative endothelial isolation plot from prostates. FSC = forward scatter. (B) Quantification of mitochondrial membrane potential (Δψ) by tetramethylrhodamine ethyl ester (TMRE) staining, n = 5 mice per condition. MFI = mean fluorescent intensity. (C) Quantification of endothelial glucose uptake by 2-NBDG. n = 6 or 7 mice per condition. (D to I) Metabolism and ATP production was assessed in shCntrl and shAdrb2 primary prostate endothelial cells after incubation with noradrenaline. (D) Oxygen consumption rates at baseline and in the presence of oligomycin, FCCP [carbonyl cyanide p-(trifl uoromethoxy) phenylhydrazone], and antimycin A + rotenone (AA+R). n = 4 independent experiments. Error bars indicate = SD. (E to H) Different analyses from the same set of experiments, n = 3 replicates per condition per time point. Metabolite levels were normalized to internal standard and to sample protein content. (E) Intracellular levels of the tricarboxylic acid cycle metabolite citrate, a.u., arbitrary units. (F) Total fraction of citrate containing 13C-label from [U-13C]-glucose. (G) Relative intracellular levels of citrate labeling derived from [U-13C]-glucose at 24 hours. (H) Fraction of each isotopologue of citrate (mass isotopologue distribution) after culture in 5mM [U-13C]-glucose for 24 hours. (I) Measurement of intracellular ATP levels in the presence or absence of antimycin A, an inhibitor of the electron transport chain. n = 3 independent experiments. *P<0.05; **P<0.01; ***P<0.001; ****P<0.0001. Error bars = indicate SEM.