
Figure 3. Estimated Exposure-response Curves for Short-term Exposures to PM2.5 and Ozone.
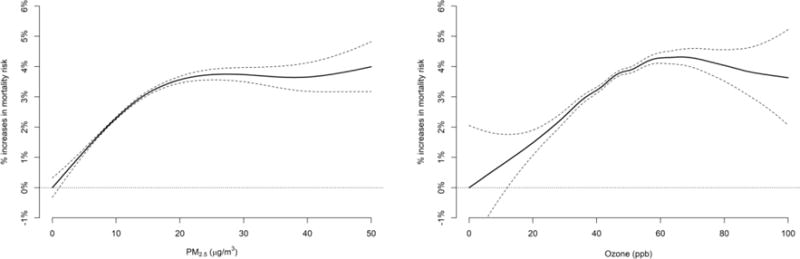
A 2-pollutant analysis with separate penalized splines on PM2.5 and ozone was conducted to assess the percentage increase in daily mortality at various pollution levels. Dashed lines indicate 95% confidence intervals. The mean of daily exposure on the same day of death and one day prior (lag 01 day) was used as metrics of exposure to PM2.5 and ozone. Analysis for ozone was restricted to the warm season (April to September).