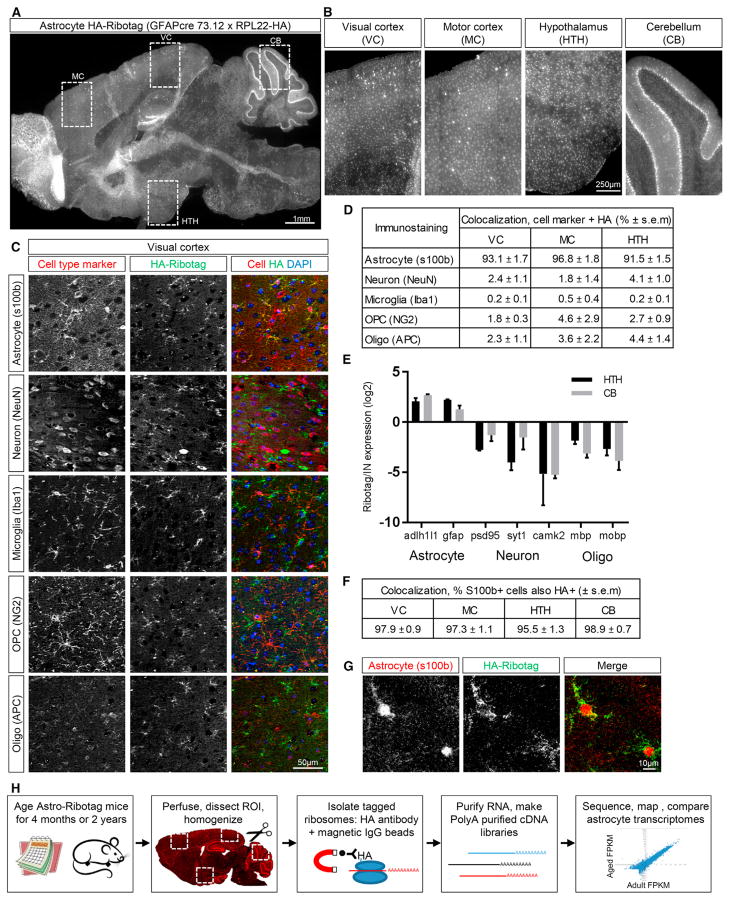
Figure 1. Characterization of the Astrocyte-Ribotag Mouse Model.
(A) Sagittal brain section from 4-month-old astrocyte-ribotag mouse immunostained for HA to visualize ribosomes; image is a mosaic of tile images acquired at 10x.
(B) Zoomed-in images from (A), regions of HA-tagged ribosome purification (VC, MC, HTH, CB); images are cropped from the mosaic tile image.
(C) Immunostaining for HA and cell-specific markers in VC to determine cell-type expression of HA-tagged ribosomes. Images cropped from a larger mosaic of tiles acquired at 20x.
(D) Quantification of cell-specific staining shows majority of HA-tagged ribosomes are in astrocytes. n = 3 × 4 month mice/brain region.
(E) qRT-PCR from HTH and CB astrocyte-ribotag-isolated mRNA shows enrichment for astrocyte mRNAs over other cell types, compared to total (input) mRNA. n = 3 × 2 year mice/brain region; graph mean ± SEM.
(F) Quantification of S100b positive cells that are also HA positive; n = 3 × 4 month mice/brain region.
(G) Immunostaining for HA and S100b shows ribosomes present throughout astrocyte processes in VC.
(H) Schematic of the experimental paradigm—purification of astrocyte-enriched mRNA from multiple brain regions of adult (4-month-old) and aging (2-year-old) mice, followed by RNA-seq and analysis.
See also Figures S1 and S2.

