
Figure 2.
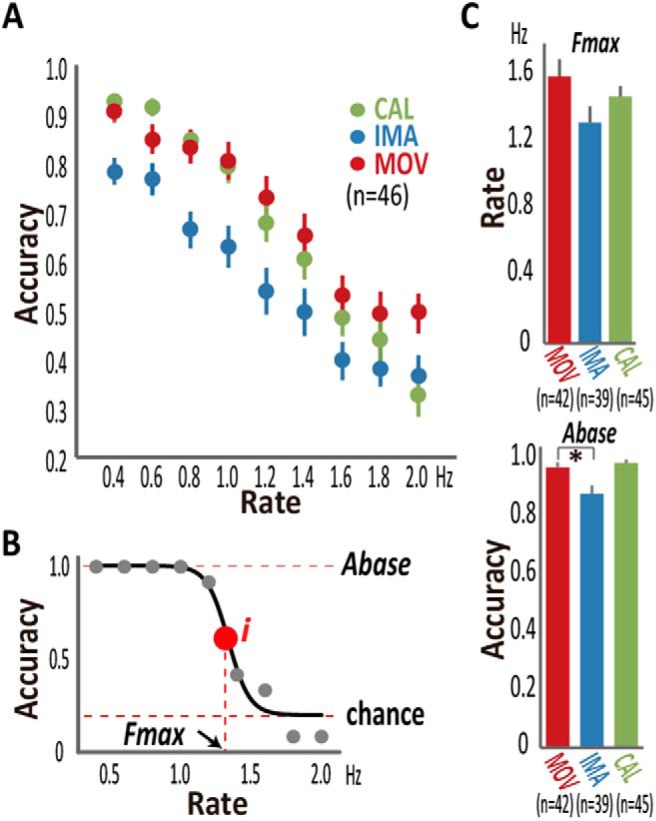
Behavioral results in healthy participants. A, Accuracy, when averaged across healthy participants (n = 46), monotonically declined in all movement (MOV), imagery (IMA), and calculation (CAL) tasks as the task rate increased. B, Sigmoid fitting (solid line) of raw (filled gray circles) accuracy data yielded the base-accuracy (Abase) and agility (Fmax) parameters for the calculation task from a representative healthy participant. The inflection point (i) corresponded to the Fmax at which accuracy fell to the midpoint between Abase and Achance (0.2). Data from some participants had to be excluded from the fitting analysis due to low accuracy and other reasons (Extended Data Fig. 2-1). C, Fmax did not significantly differ between the tasks, but Abase of IMA was lower than that of MOV and marginally lower than that of CAL. Error bars: SEM, *p < 0.0.5.