Figure 3.
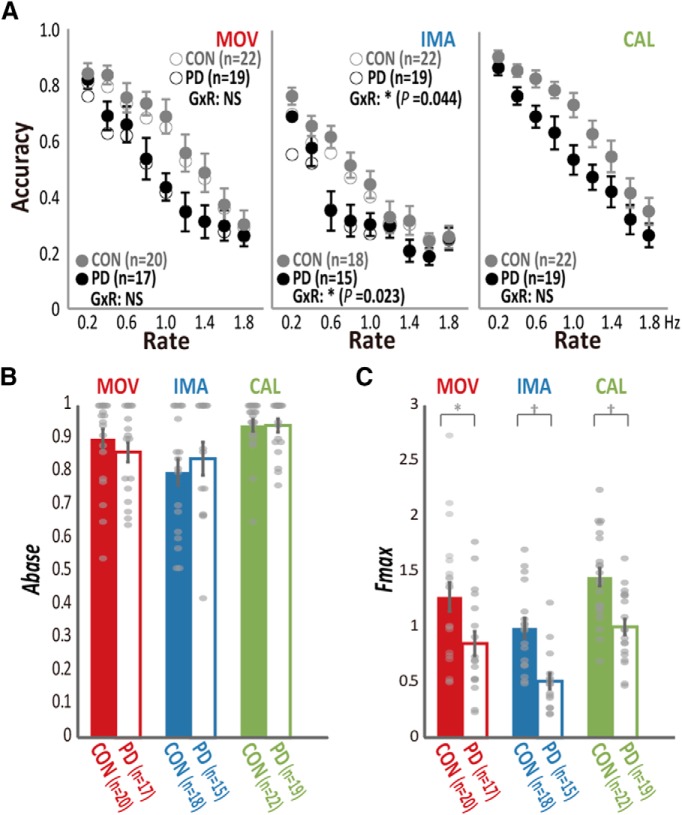
Comparison of the raw accuracy and fitted parameters (Abase and Fmax) between participants with PD and controls (CON) in the behavioral experiment. A, Accuracy data averaged across participants in PD (black) and CON (gray) for each rate of the movement (MOV), imagery (IMA), and calculation (CAL) tasks (see Extended Data Fig. 3-1 for the statistical values). Open and filled circles represent the group mean before and after the exclusion of data, respectively, according to the accuracy criterion used for the fitting analysis in the movement and imagery tasks. Although the effects of both GROUP (G) and RATE (R) were significant for all the tasks, only IMA revealed significant group-by-rate interactions (GxR) regardless of the data exclusion, supporting slowing of imagery in participants with PD. Error bars are omitted for the data before the exclusion (open circles) for the clarity of visualization. B, The fitting analysis indicated that the Abase was preserved in participants with PD for MOV, IMA, and CAL tasks. Gray dots represent data from each participant. C, In the fitting analysis, participants with PD showed reduced agility (Fmax) in all tasks; *p < 0.05, †p < 0.01. Error bars: SEM.

