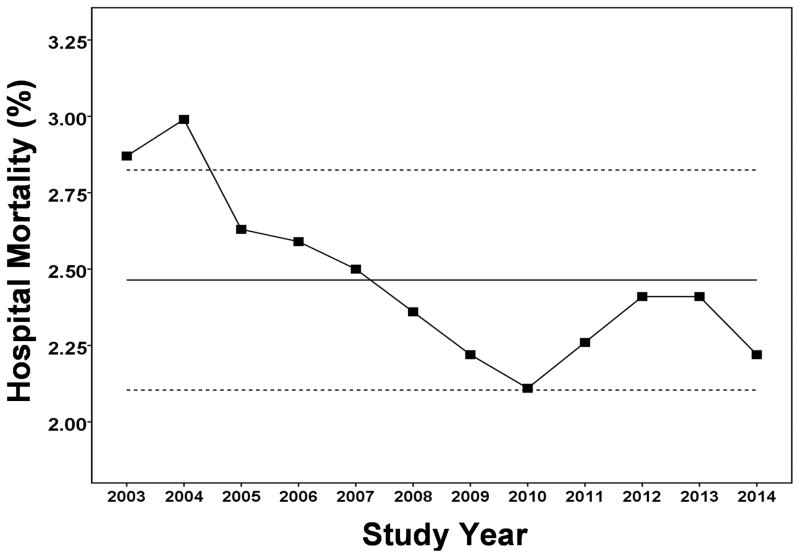
Figure 1.
Hospital mortality for January 1, 2003 through December 31, 2014 for the eight general medicine units. Solid line represents the mean value with the dashed lines depicting the upper and lower limits of the 95% confidence intervals. P = 0.002 for the year-to-year decrease in hospital mortality for patients admitted to the general medicine units.

