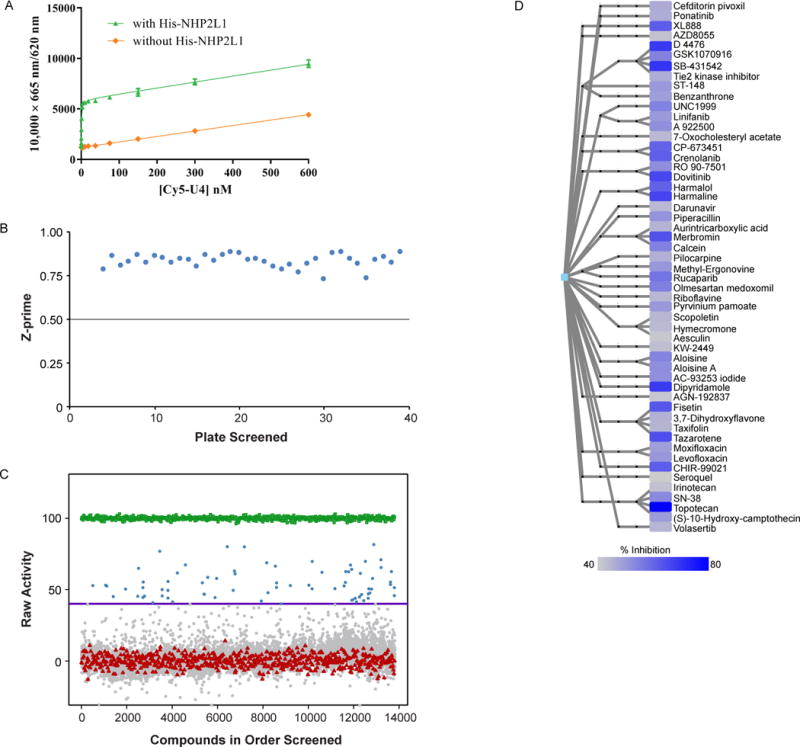
Figure 1.

Specific interaction of NHP2L1 protein and U4 and Results of the primary screen of small molecule inhibitors of NHP2L1-U4 interaction. (A) Increasing concentrations of Cy5-U4 5′ SL were incubated with 2nM Terbium-anti-His and 2nM His-NHP2L1. The TR-FRET signals are depicted at each concentration of Cy5-U4 5′ SL, after an incubation of 45 min which led to Kd of 0.68 nM. (B) Scatterplot of plate Z-prime in the order of plates screened. Each dot represents the Z-prime value of the corresponding plate. The averaged Z prime values [0.83 ± 0.04 (0.72 to 0.88)], consistently exceeded plate acceptance criteria indicated by horizontal line (Z prime> 0.5). (C) Scatterplot of percentage inhibition of 10,173 compounds tested at single concentration (15μM) in the primary TR-FRET assay (Blue=hits [≥40% inhibition], grey=inactive [<40% inhibition], red=negative control, green=positive control). (D) Hierarchical chemical clustering of small molecules found to be inhibitors of the NHP2L1-U4 interaction. Leaf nodes represent the actual molecules tested and are color-coded according to percentage of inhibition (darker blue corresponds to greater inhibition, according to the color scale shown). Intermediate nodes represent scaffolds at various levels of chemical abstraction, and edges between nodes signify chemical similarity as described in the methods.
