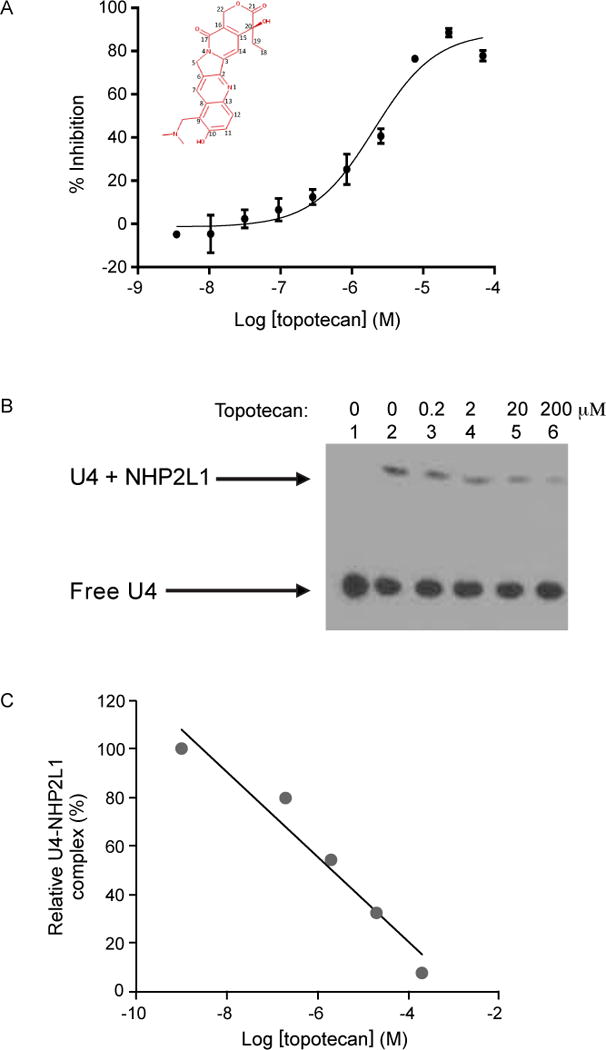
Figure 2.

Analysis of the effect of topotecan on NHP2L1-U4 interaction. (A) Increasing concentrations of topotecan were incubated for 45 min with 2nM Tb-anti-His, 2nM His-NHP2L1, 2nM Cy5-U4 5′ SL. The TR-FRET signals were determined and converted into percentage of inhibition by reference to controls. A sigmoid curve was fitted to the resulting data using GraphPad Prism 6.07. IC50 value was determined from log [concentration]-percent inhibition curve constructed for topotecan. (B) EMSA was performed using biotin labeled U4 5′ SL (lanes 1, 2, 3, 4, 5, 6). NHP2L1 protein was added to the assay (lanes 2, 3, 4, 5, 6). Increasing concentrations of topotecan were added to the reactions (lanes 3 [0.2μM], 4 [2μM], 5 [20μM], 6 [200μM]). The shifted band (lane 2) indicates that NHP2L1 binds to Biotin-U4 5′SL. (C) The degree of displacement was determined by measuring by densitometry of the shifted band using ImageJ and the results were expressed as a percentage of the NHP2L1 U4 complex without topotecan.
