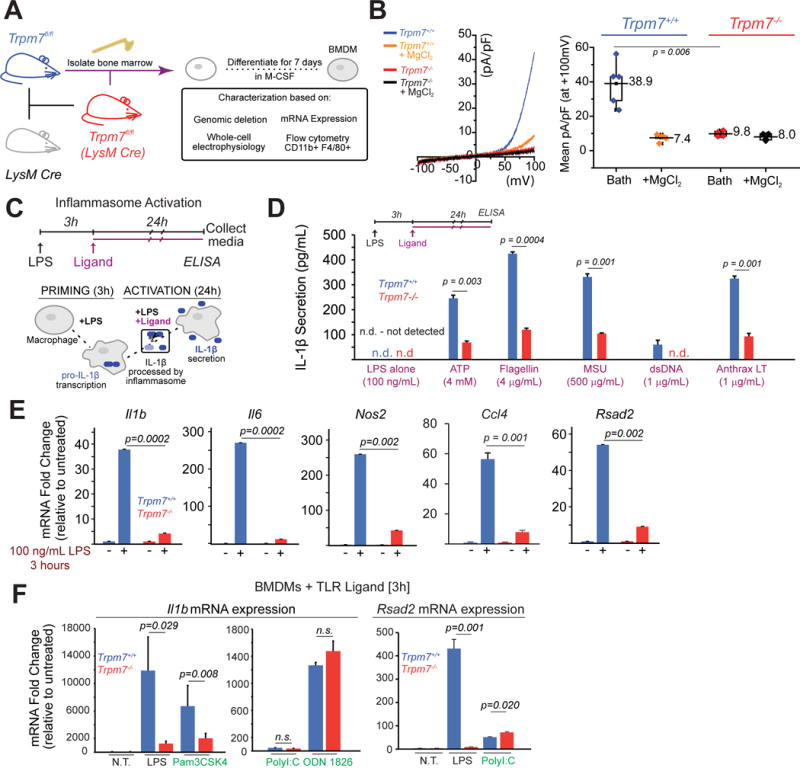
Figure 1. Characterization of Trpm7fl/fl (LysM Cre) mice and Trpm7-deficient macrophages.

(A) Schematic showing generation of Trpm7fl/fl (LysM Cre) mice and bone-marrow-derived macrophage (BMDM) culture.
(B) A representative I-V relationship of whole-cell Mg2+-inhibitable ITRPM7 in freshly isolated Trpm7fl/fl [Trpm7+/+] and Trpm7fl/fl (LysM Cre) [Trpm7−/−] peritoneal macrophages (left panel). The statistics of TRPM7 current densities (n=5) are shown as box charts (right panel).
(C) Schematic of inflammasome activation assay used for results shown in panel D. The inflammasome activating ligands were added after 3h of LPS priming (100 ng/mL). The secreted IL-1β in the culture supernatants (collected at 24h) was quantified by ELISA.
(D) Quantification of secreted IL-1β in the supernatants of Trpm7+/+ and Trpm7−/− BMDMs, stimulated with indicated inflammasome activating ligands, as depicted in panel C. Error bars represent SEM, n=4.
(E) Gene expression analysis (qRT-PCR) of Trpm7+/+ and Trpm7−/− BMDMs after stimulation with 100 ng/mL LPS (3h). Changes in mRNA levels, relative to untreated BMDMs are shown. Error bars represent SD (Means representative of n=3 independent experiments).
(F) Gene expression analysis (qRT-PCR) of Trpm7+/+ and Trpm7−/− BMDMs after stimulation with indicated ligand (3h). BMDMs treated with LPS (100 ng/ml), Pam3CSK4 (100 ng/mL), PolyI:C (25 μg/mL), or ODN 1826 (1 μM). Changes in mRNA levels, relative to untreated BMDMs are shown. Error bars represent SD (Means representative of n=3 independent experiments).
