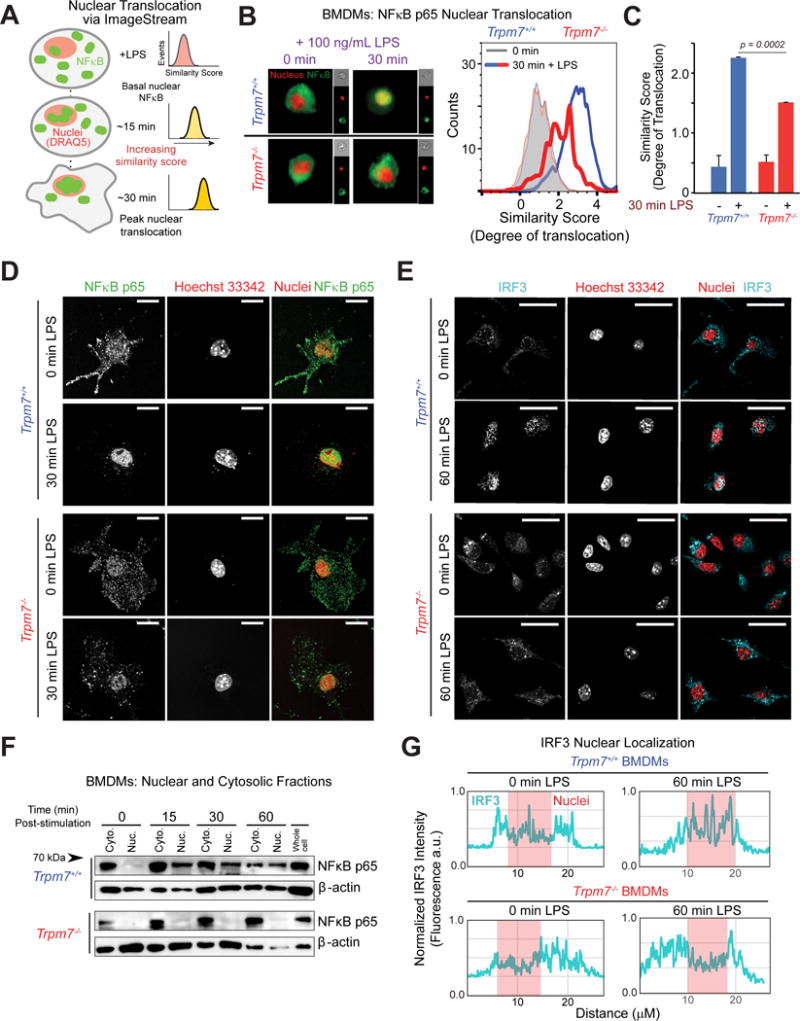
Figure 3. LPS-induced nuclear translocation of NFκB p65 and IRF3 is defective in Trpm7-deficient BMDMs.

(A) Schematic of ImageStream analysis of LPS-induced NFκB translocation. Quantification of nuclear translocation is reflected by and directly proportional to the similarity scores of NFκB and nuclear staining. Similarity scores of individual cells are displayed together as a histogram.
(B) Representative images (n> 2000 cells) taken from ImageStream flow cytometry analysis of indicated BMDMs, stimulated with LPS (100 ng/mL, 30m) and stained with anti-NFκB p65 antibody and DRAQ5 (nuclear stain) (left panels). An overlaid image of NFκB p65 staining (green) and DRAQ5 (red) is shown and the single channel images of that cell are shown on the right in smaller sizes. The overlay of histograms depicts the representative similarity scores derived for each condition (right panel), quantified in Panel C (n=4).
(C) Quantification of ImageStream flow cytometry results depicted in Panel B. Error bars are SEM (n=4).
(D) Confocal immunofluorescence microscopy images of fixed BMDMs, treated or untreated with LPS (100 ng/ml, 30m) as indicated, and stained with anti-NFκB p65 and Hoechst nuclear stain. Images shown are a single optical section (0.25 μm). Scale bar = 15 μm. Typical results of n=3 experiments.
(E) Confocal immunofluorescence microscopy images of fixed BMDMs, treated or untreated with LPS (100 ng/ml, 60m) and stained with anti-IRF3 and Hoechst nuclear stain. Images shown are a single optical section (0.25 μm). Scale bar = 25 μm.
(F) Immunoblot analysis of NFκB p65 present in cytosolic and nuclear fractions obtained from indicated BMDMs at various time points after LPS (100 ng/ml) treatment. Immunoblots of β-actin in each fraction is also shown. These are representative results of independent experiments (n=3).
(G) Linear intensity analysis of IRF3 nuclear localization. Fluorescent intensity of IRF3 signal (cyan) was measured with a single x-y plane line trace; location of nuclei is overlayed (red). Line traces depict typical cells from panel E and are illustrated in Fig. S4H.
