
Figure 4. LPS signaling and NFκB translocation are abrogated by clamping intracellular Ca2+ but there is no further decrease in Trpm7-deficient macrophages.
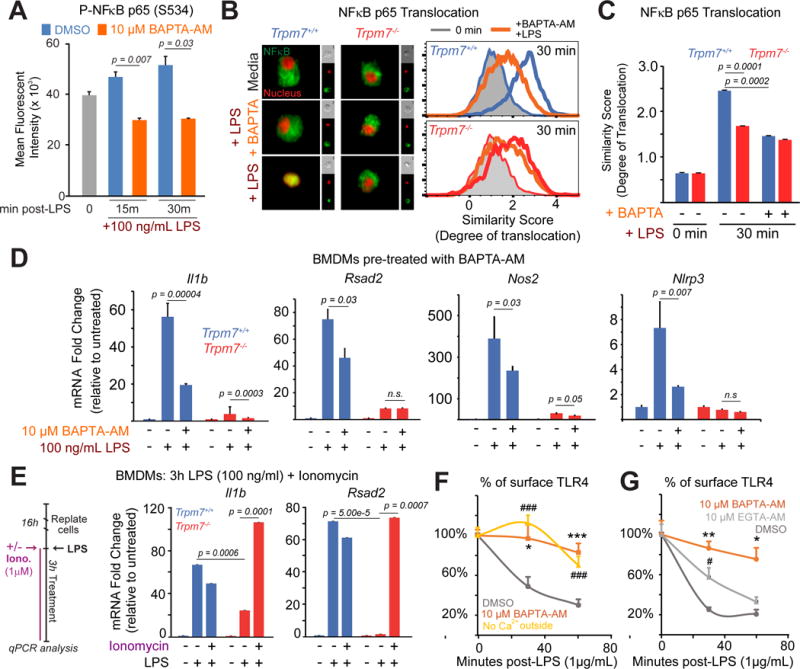
(A) Flow cytometry-based quantification of phospho-NFκB p65, as indicated by MFI, in DMSO (vehicle control) and BAPTA-AM loaded BMDMs in response to LPS (100 ng/mL, indicated time points). The error bars represent SEM (n=3).
(B) Representative images (n>5000 cells) from ImageStream analysis of DMSO and BAPTA-AM loaded cells are shown (left panel). Cells were stimulated with LPS (100 ng/ml, 30m) and then stained with anti-NFκB p65 antibody and DRAQ5 (a nuclear stain), prior to ImageStream analysis. To the right of the merged image of NFκB p65 (green) and DRAQ5 (red), single channel images of that cell are shown in smaller sizes. Overlaid histograms of similarity scores derived from each condition are shown (right panels); unstimulated (grey-filled), BAPTA-AM pre-treated (orange), and LPS treated (blue-wt; red-KO) are shown. The data are representative and typical of independent experiments (n=2).
(C) Quantification of similarity scores from panel B, reflecting the degree of NFκB p65 translocation in indicated conditions. Error bars represent SEM (n=3).
(D) qRT-PCR analysis of indicated inflammatory genes in Trpm7+/+ and Trpm7−/− BMDMs treated as depicted. Prior to LPS treatment (100 ng/mL, 3h), BMDMs were pre-treated with DMSO or BAPTA-AM for 30 min in serum-free media. Error bars represent SD (n=3).
(E) qRT-PCR analysis of indicated inflammatory genes in Trpm7+/+ and Trpm7−/− BMDMs treated as indicated in the schematic of the experimental design (left panel). Mean expression relative to untreated condition (right panel). Ionomycin is added with LPS to induce Ca2+ influx. Error bars represent SD (n=3).
(F) Flow cytometry-based quantification of cell surface TLR4 in RAW 264.7 cells at indicated times after LPS (1 μg/mL) treatment. Cells were treated with BAPTA-AM or DMSO as indicated prior to LPS treatment. Extracellular Ca2+-free conditions supplemented 10 mM EGTA. The error bars reflect SEM (n=3). * is BAPTA-AM treatment and # is low Ca2+ outside relative to wt. * indicates p<0.05, *** or ### indicates p<0.001.
(G) Flow cytometry-based quantification of cell surface TLR4 in RAW 264.7 cells at indicated times after LPS (1 μg/mL) treatment. Cells were treated with BAPTA-AM, EGTA-AM, or DMSO as indicated prior to LPS treatment. The error bars reflect SEM (n=3). * is BAPTA-AM treatment and # is EGTA-AM relative to wt. * or # indicates p<0.05, ** or ## indicates p<0.01.