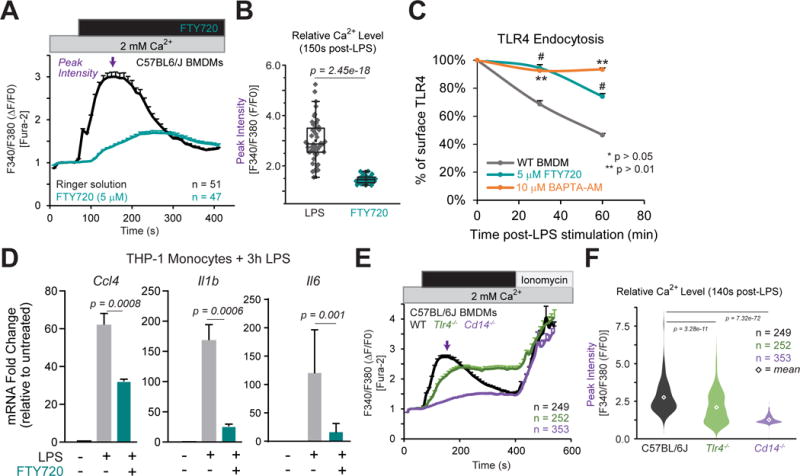
Figure 6. Blocking TRPM7 channel activity abrogates LPS-induced Ca2+ entry and TLR4 endocytosis.

(A) Relative changes in [Ca2+]i over time in C57BL/6 BMDMs treated with LPS (100 ng/ml) or LPS+FTY720 (5μM) for 5 min. Trace represents mean ∆F340/F380 ratio from all samples and error bars are SEM. Ionomycin (1 μM) was perfused as a positive control. Results are from n=3 independent experiments; n value indicated in figure.
(B) Quantification of peak [Ca2+]i after LPS stimulation from Fig 6A. Box-whisker plot is overlaid on individual measurements.
(C) Flow cytometry based measurement of cell surface TLR4 levels in BMDMs, pre-treated with either vehicle (DMSO), FTY720, or BAPTA-AM for 15 min, and then stimulated with LPS as indicated. The relative change in the percentage of cell surface TLR4 levels was inferred based on mean MFI values. Error bars represent SEM (n=3; * indicates p < 0.05, ** p < 0.01). * indicates significance from WT relative to BAPTA-AM; #, FTY720 group. These results represent typical results obtained in n=2 independent experiments.
(D) Gene expression analysis (qRT-PCR) of human THP-1 monocytes stimulated with LPS (100 ng/ml; 3h) with FTY720 pre-treatment as indicated. Bar charts represent mean of n=3 independent experiments. Error bars are SEM (n=3).
(E) Relative changes in [Ca2+]i over time in BMDMs treated with LPS (100 ng/ml) for 5 min. Ionomycin (1 μM) was perfused as a positive control. Traces represent mean ∆F340/F380 ratio from all samples measured and error bars are SEM. Results are representative from n=5 independent experiments.
(F) Quantification of peak [Ca2+]i after LPS stimulation from Fig 6E. Violin plot is shown to illustrate range and distribution of data points; diamond indicates mean value for group. One-way ANOVA (F[2,851] = 266.23) indicates p = 1.6e–90. T-test used to compare groups with C57BL/6J BMDMs.
