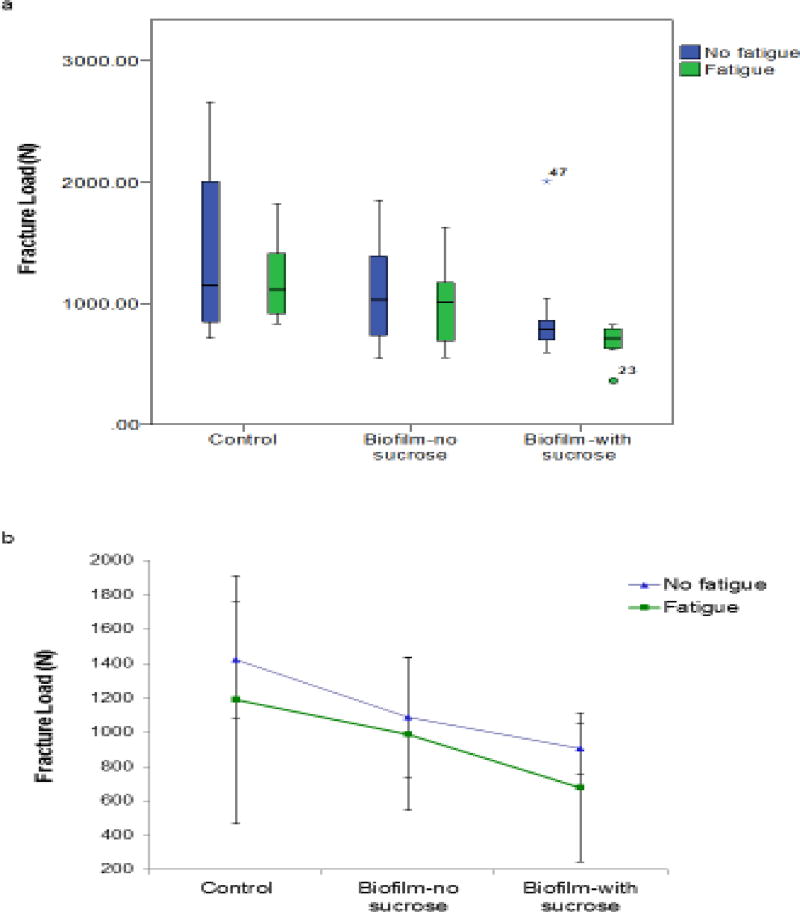
Figure 6.
Data distribution and mean profile of fracture loads: a) Box plots displaying the median fracture load (black bar dividing each box) for each group and condition. Each box represents the inter-quartile range. End of whiskers are the minimum and maximum load values (except for outliers). b) Profile plots presenting the mean fracture load values and standard deviation for each group and condition.

