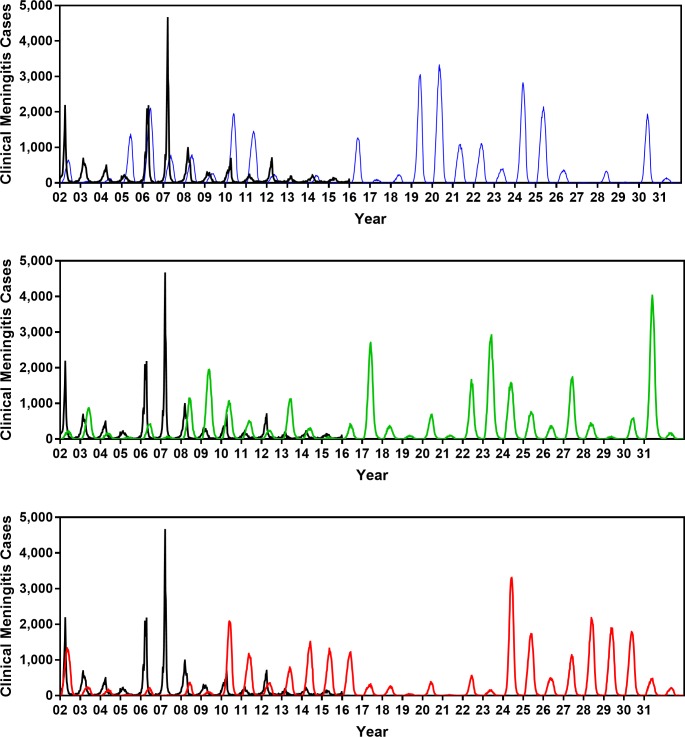
Fig 4. Comparing the clinical meningitis time series observed between 2002 and 2015 in Burkina Faso (black curve) with three simulated trajectories produced by the calibrated model (blue, green, and red curves).
The periodicity at which simulated epidemics are occurring matches the periodicity of observed epidemics. Fig 3 shows that trajectories generated by our model also match other key properties of meningococcal epidemics in Burkina Faso (e.g., age distribution of cases, age-specific carriage prevalence, average weekly incidence, and number of districts in each year between 2002 and 2015 in which the threshold of 10 meningitis cases per 100,000 population was exceeded).

