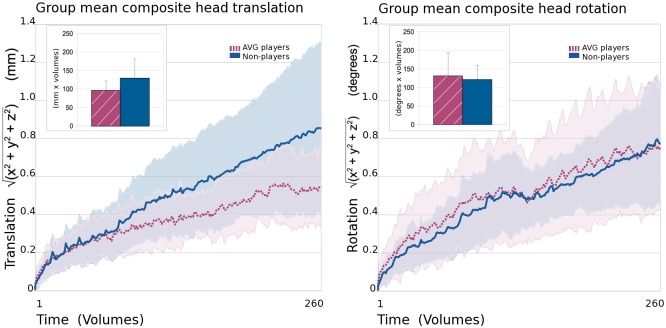
Fig 2. Translational and rotational head movement.
Group mean composite (x, y, and z directions) translational head motion (left panel) and rotational head motion (right panel). Data from the action video game (AVG) player group are represented by dashed burgundy lines and non-player data are represented by solid blue lines. Standard deviations are shown in paler colours around main plotted lines. Comparisons of estimates of area under the curve (using Riemann sums) for the gamer (hatched burgundy) and non-gamer (blue) groups are shown inset at the top left of each panel. Error bars represent standard deviation. No significant group differences in area under the curve were detected indicating that the overall amount of head motion in the scanner did not significantly differ between the AVG player and non-player groups.

