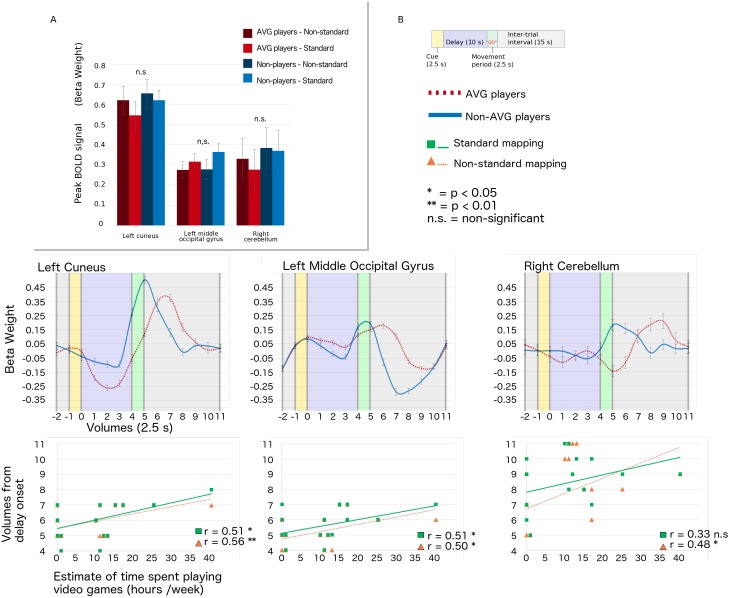
Fig 4. Relationship between the timing of peak BOLD response and time spent playing.
A) Histogram of peak beta weights of trials of the standard and non-standard visuomotor mapping tasks for action video game (AVG) players (burgundy) and non-players (blue) for the full trial time course. Only regions of interest in which AVG players had significantly lower amplitude BOLD signal than non-players in the instructed-delay epoch of trials are shown. Error bars represent standard deviation. No statistically significant differences in peak signal amplitude were observed between experimental groups or visuomotor tasks. B) Top plots: Event-related averages of fMRI activity over trials time-locked to the onset of the delay period. Time-courses associated with the standard and non-standard mapping tasks have been pooled for visual clarity. Error bars represent standard deviation. Time-courses for AVG players shown with burgundy dashed lines and non-players shown with blue solid lines. Bottom plots: Linear regression results showing relationships between the timing of peak BOLD signal and estimates of time spent playing AVGs. Results for the standard mapping task shown with green squares and solid lines. Results for the non-standard mapping task shown with orange triangles and dashed lines. See Table 3 for specific p-values.

