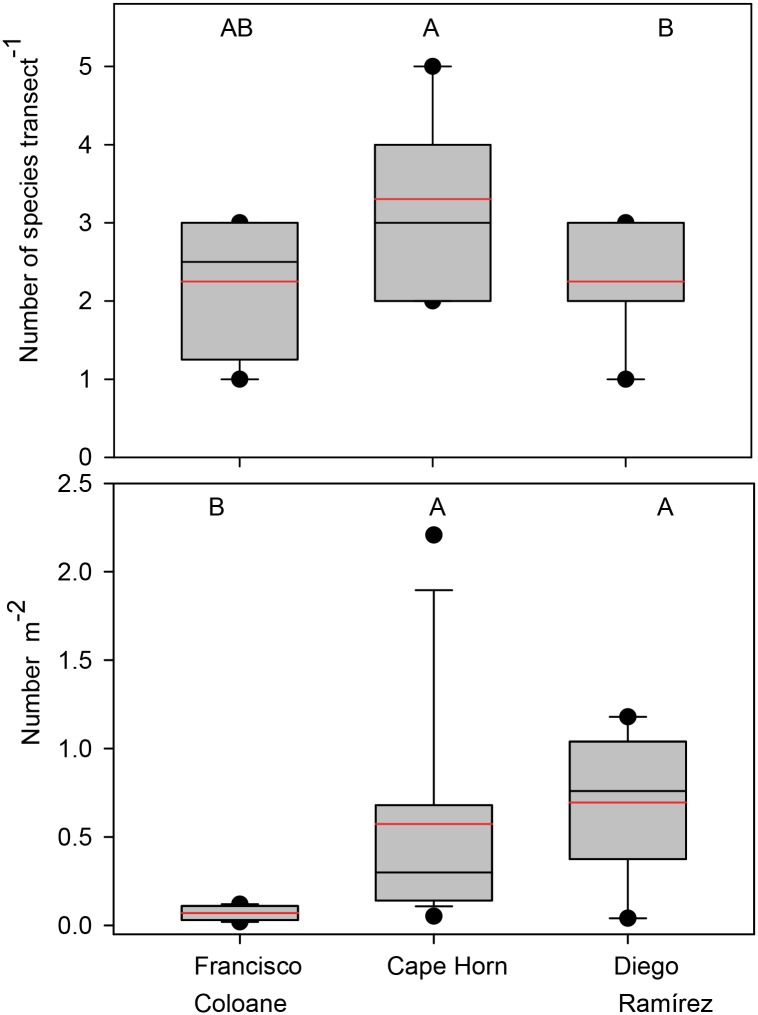
Fig 5. Fish assemblage characteristics among the three sub-regions.
Box plots showing median (black line), mean (red dashed line), upper and lower quartiles, and 5th and 95th percentiles. Kruskal-Wallis Rank Sum comparisons among regions were statistically different for species richness (X2 = 13.3, p = 0.001) and numerical abundance (X2 = 4.9, p = 0.08). Regions with the same letter are not significantly different (Steel-Dwass unplanned multiple comparisons procedures, a = 0.05).

