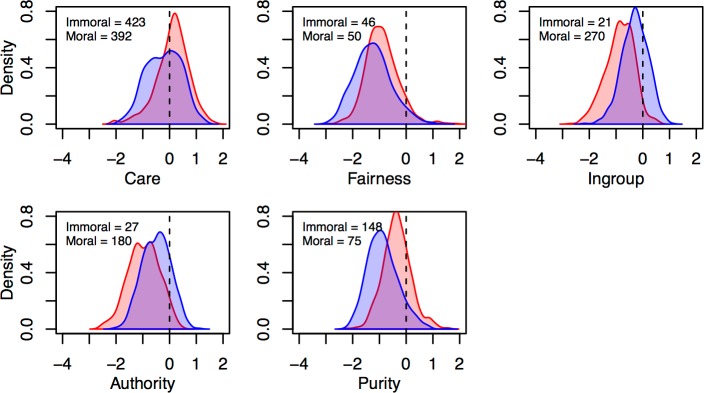
Fig 5. Density plots of image uniqueness score distributions for each moral foundation by moral valence.
Morally good images (blue) are defined as having mean moral ratings > 3.5, and morally bad images (red) as having mean moral ratings < 2.5. Number of morally good and bad images per foundation with uniqueness scores > 0 inset.

