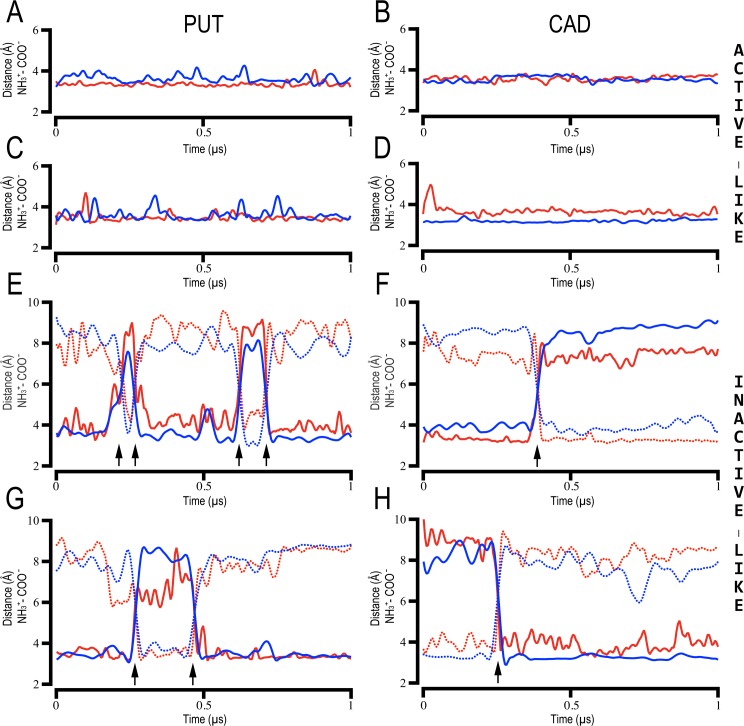
Fig 4. Stability of interactions between PUT and CAD and human TAAR6 and TAAR8.
Time evolution (x-axis) of intermolecular distances (y-axis) between Asp3.32/5.43 (-COO-) and PUT/CAD (-NH3+) in 1.0 μs unbiased MD simulations. Each plot corresponds to one of the eight simulated ligand-receptor molecular complexes: hTAAR6active-like/PUT (A), hTAAR6active-like/CAD (B), hTAAR8active-like/PUT (C), hTAAR8active-like/CAD (D), hTAAR6inactive-like/PUT (E), hTAAR6inactive-like/CAD (F), hTAAR8inactive-like/PUT (G), hTAAR8inactive-like/CAD (H). Continuous and dotted lines correspond to distances between N1 and N2 atoms of the ligands with Asp3.32 (red) and Asp5.43 (blue) carboxyl groups, respectively. Black arrows at the bottom indicate the flip-transitions (180° rotation) of PUT and CAD in the binding pocket of the inactive-like models.

