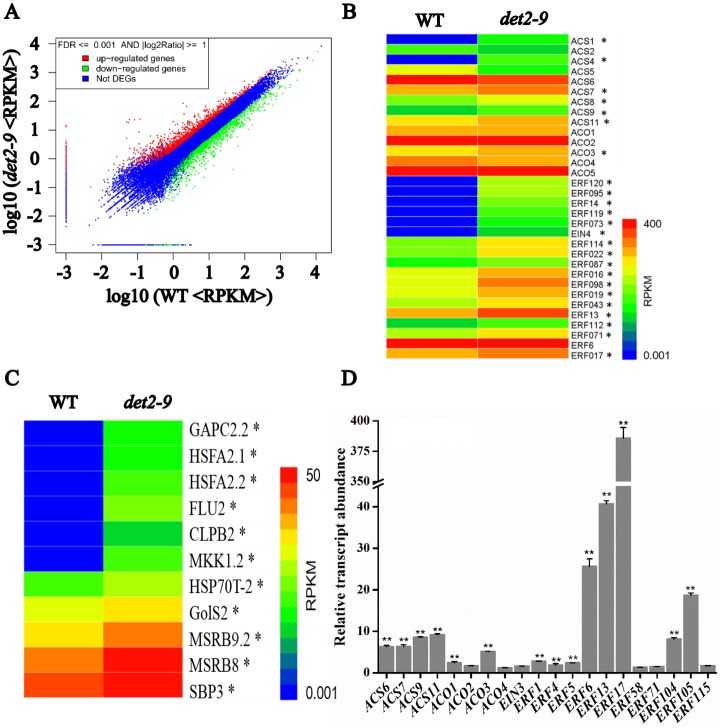
Fig 2. RNA-Seq analysis of the det2-9 and WT root transcriptome.
(A) Differential transcription in det2-9 and WT. Genes, which were significantly induced or repressed in det2-9 compared with WT, appear in, respectively, the upper left (in red) and bottom right (in green) hand portions of the plot. RPKM: reads per kilobase per million reads, DEGs: differentially expressed genes. (B, C) A heat map representation of the transcriptional behavior of genes associated with ethylene (B) and responding to ROS (C) based on the GO analysis. *: means more than two times up change in the expression genes of det2-9 compared to WT. (D) A qRT-PCR expression analysis of a selection of genes related to ethylene in det2-9 compared to WT. Data shown are mean±SE (n = 3), **: means of det2-9 and WT differ significantly (P<0.01).

