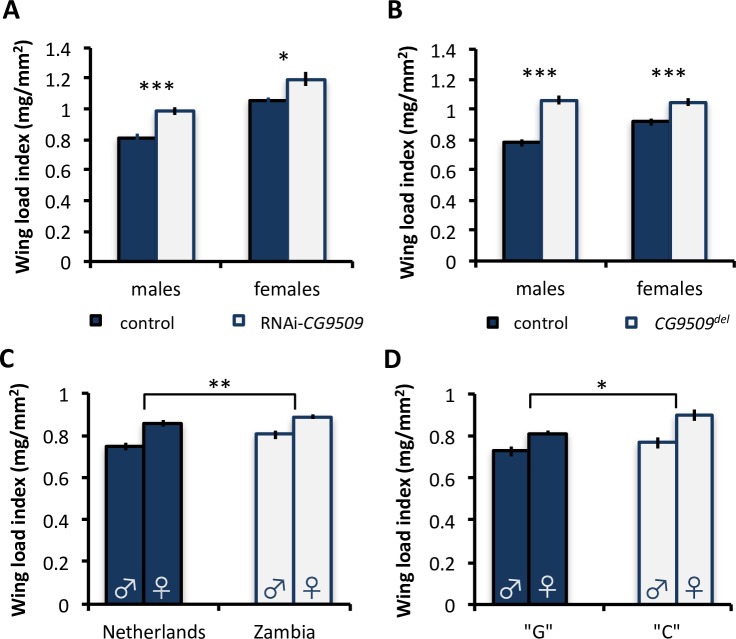
Fig 6. Effect of CG9509 expression on wing loading.
Wing load index in (A) control (blue; N = 10–15 per sex) and RNAi-CG9509 (white; N = 10 per sex) flies, (B) control (blue; N = 20 per sex) and CG9509del (white; N = 14–15 per sex) flies, (C) flies from a Dutch (blue; N = 12 isofemale strains with 5 replicates each per sex) and a Zambian (white; N = 10 strains with 5 replicates each per sex) population, and (D) flies from the Dutch population partitioned according to the sequence variant at position 67. The high-expression, cosmopolitan “G” variant (6 strains with 5 replicates each per sex) is shown in blue, and the low-expression, sub-Saharan “C” variant (6 strains with 5 replicates each per sex) is shown in white. Underlying data can be found in S1 Data. Error bars represent the standard error of the mean. (A,B) Significance was assessed via a t test. (C,D) Significance was assessed using an ANOVA with sex, isofemale line, and population or variant at position 67 as factors. *P < 0.05, **P < 0.01, ***P < 0.005.

