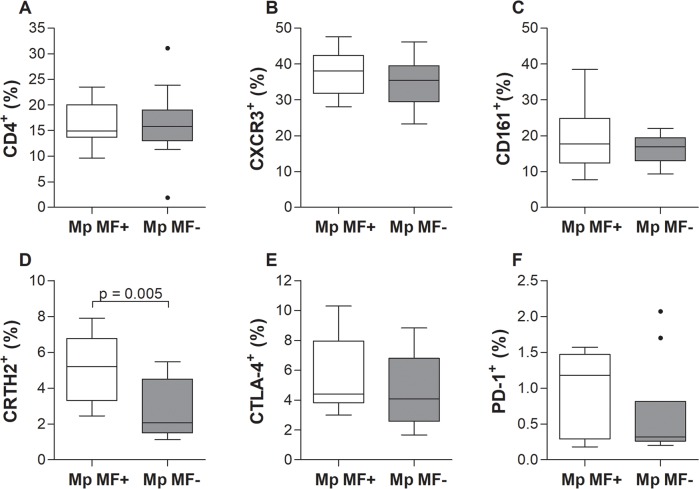
Fig 5. Increased CD4+CRTH2+ Th2 cell frequencies in peripheral blood of M. perstans microfilaremic individuals.
Using flow cytometry, peripheral whole blood cells from M. perstans microfilaremic (Mp MF+; n = 11) and amicrofilaremic (Mp MF-; n = 10) individuals were analyzed for frequencies (%) of (A) CD4+ T cells on lymphocytes and CD4+ T cells expressing (B) CXCR3, (C) CD161, (D) CRTH2, (E) CTLA-4 or (F) PD-1. Graphs show box whiskers with median, interquartile ranges and outliers. Statistical significances between the indicated groups were obtained using the Mann-Whitney-U-test.

