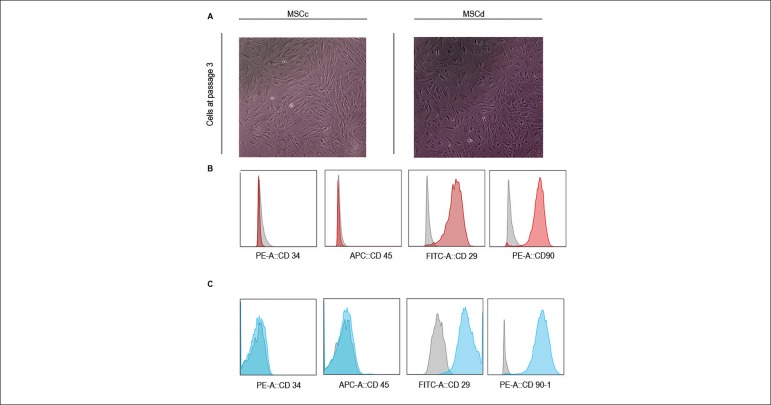
Figure 2.
Characterization of MSC profile on third passage. (A) Similar fibroblast-like morphology of MSCc and MSCd 4 days after the cells were seeded onto culture dishes. (B) Flow cytometry analysis of MSC derived from healthy animals (MSCc) and (C) MSC derived from diabetic animals (MSCd). Color histograms showing high expression of mesenchymal surface proteins (CD29 and CD90) and low expression of hematopoietic markers (CD34 and CD45). The gray histograms represent the isotype controls.

