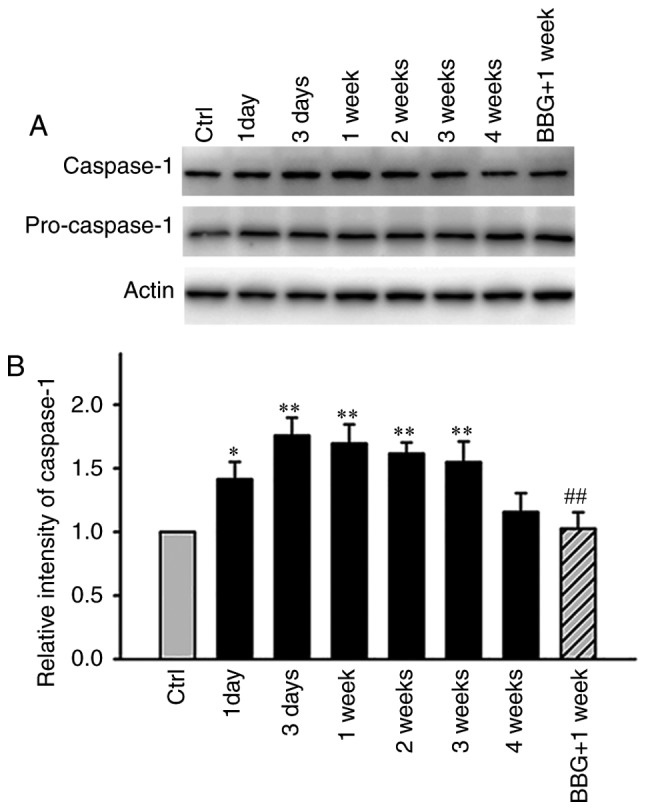
Figure 5.

Differences in the protein levels of caspase-1 in COH retinas and BBG-induced effects on caspase-1 expression in G1 week retinas. (A) Representative immunoblots presenting the pro-caspase-1 and caspase-1 levels in the Ctr and COH retinal extracts at different postoperational time periods. The immunoblot of G1 week retinas following BBG pretreatment is displayed in the last lane. (B) Bar chart summarizing the average densitometric quantification of immunoreactive bands of the relative caspase-1 expression, according to pro-caspase-1 among the different groups (n=3/group). *P<0.05 and **P<0.01 vs. Ctr; ##P<0.01 vs. 1W (G1 week). Ctr, control; G, glaucomatous model; COH, chronic ocular hypertension; BBG, Brilliant Blue G; 1D, 1 day following COH surgery; 3D, 3 days following COH surgery; G1 week/1W, 1 week following COH surgery; 2W, 2 weeks following COH surgery; 3W, 3 weeks following COH surgery; 4W, 4 weeks following COH surgery; BBG+1W, BBG pretreatment in G1 week retinas.
