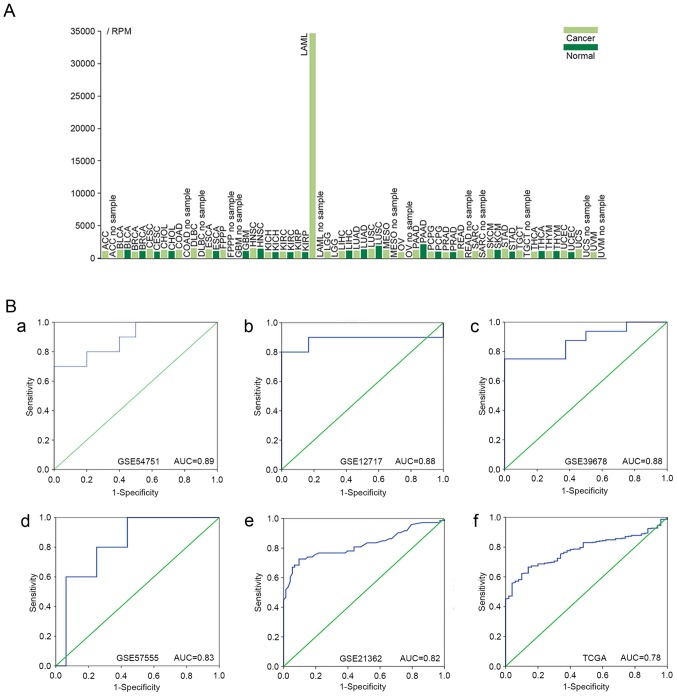
Figure 3.
Expression profiles. (A) TCGA expression profiles of miR-223-3p in different diseases. The light green bars represent cancer tissues. The dark green bars represent normal tissues. ACC, adenoid cystic carcinoma; BLCA, bladder urothelial carcinoma; BRCA, breast invasive carcinoma; CESC, cervical squamous cell carcinoma and endocervical adenocarcinoma; CHOL, cholangiocarcinoma; COAD, colon adenocarcinoma; DLBC, diffuse large B-cell lymphoma; ESCA, esophageal carcinoma; FPPP, Formalin-fixed Paraffin Pilot Project; GBM, glioblastoma multiforme; HNSC, head and neck squamous cell carcinoma; KICH, chromophobe renal cell carcinoma; KIRC, kidney renal clear cell carcinoma; KIRP, kidney renal papillary cell carcinoma; LAML, acute myeloid leukemia; LGG, brain lower grade glioma; LIHC, liver hepatocellular carcinoma; LUAD, lung adenocarcinoma; LUSC, lung squamous cell carcinoma; MESO, mesothelioma; OV, ovarian serous cystadenocarcinoma; PAAD, pancreatic adenocarcinoma; PCPG, pheochromocytoma and paraganglioma; PRAD, prostate adenocarcinoma; READ, rectum adenocarcinoma; SARC, sarcoma; SKCM, skin cutaneous melanoma; STAD, stomach adenocarcinoma; TGCT, testicular germ cell cancer; THCA, papillary thyroid carcinoma; THYM, thymoma; UCEC, uterine corpus endometrial carcinoma; UCS, uterine carcinosarcoma; UVM, uveal melanoma; TCGA, The Cancer Genome Atlas; RPM, reads per million. (B) miR-223-3p ROC curves in GEO and TCGA datasets. (a) ROC of GSE54751; (b) ROC of GSE12717; (c) ROC of GSE39678; (d) ROC of GSE57555; (e) ROC of GSE21362; (f) ROC of TCGA dataset. ROC, receiver operating characteristic; GEO, Gene Expression Omnibus; TCGA, The Cancer Genome Atlas.

