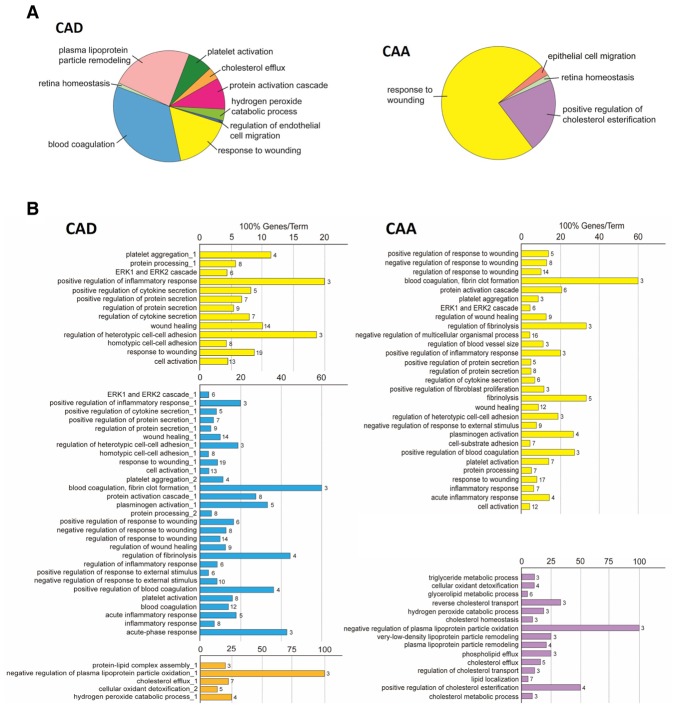
Figure 3.
Biological process of differentially expressed proteins in KD with CAD and CAA. (A) Pie charts representing the distribution of identified differentially expressed proteins according to their biological process. (B) Bar charts demonstrating the specific processes that correspond to the classification; the same color key that was used in the pie charts has also been applied in these charts. P<0.05 was used as a threshold for gene ontology categories enrichment. KD, Kawasaki disease; CAA, coronary artery aneurism; CAD, coronary artery dilation.

